From NPS to CES: Choosing the Right CX Metric
Vishal was having coffee with his former colleague Alex last week, who now heads customer experience at a growing fintech company. She looked exhausted. "We've been tracking NPS religiously for three years," she admitted. "Our scores are decent, but churn is still increasing. Leadership keeps pushing for higher NPS, but I'm not convinced it's telling us what we really need to know." As she described her team's frustrations, Vishal recognized a common CX measurement trap—relying on a single metric to guide an entire customer experience strategy. That conversation inspired him to dig deeper into the evolving landscape of CX metrics and explore how companies can build measurement frameworks that truly drive business outcomes.
Introduction: Beyond the Single-Metric Mindset
The customer experience measurement landscape has evolved dramatically from the days when satisfaction surveys alone were considered sufficient feedback mechanisms. Today's sophisticated CX programs employ multiple complementary metrics that together provide a holistic view of the customer journey and its impact on business performance.
Research from Forrester reveals that companies with mature CX measurement systems are 2.5 times more likely to outperform their sectors in revenue growth. However, the same research indicates that 71% of businesses struggle to connect their CX metrics to financial outcomes, and 63% report using metrics that don't effectively predict customer behavior.
The proliferation of metrics—from Net Promoter Score (NPS) to Customer Effort Score (CES), Customer Satisfaction (CSAT), Customer Lifetime Value (CLV), and many others—has created both opportunity and confusion. Each metric illuminates different aspects of the customer experience, but none provides a complete picture on its own.
1. Understanding the Purpose of Major CX Metrics
Different metrics serve different strategic purposes, and their utility varies depending on context:
a) Net Promoter Score (NPS)
NPS measures customer loyalty by asking how likely customers are to recommend a company to others on a scale of 0-10. Created by Bain & Company in 2003, it's become the most widely adopted CX metric globally.
Strengths: Simple to implement, easy to understand, enables benchmarking across industries.
Limitations: Doesn't explain why customers feel as they do, correlates less strongly with repurchase behavior in certain industries, and provides limited actionable insights.
Best application: Relationship tracking and high-level experience assessment in B2C environments where word-of-mouth significantly influences acquisition.
b) Customer Effort Score (CES)
CES measures the ease of customer interactions, typically asking customers to rate how much effort was required to resolve an issue or complete a task.
Strengths: Strong predictor of repurchase behavior and customer loyalty, particularly in service contexts. Research suggests reducing customer effort can decrease costs by up to 37% while increasing first-contact resolution.
Limitations: Narrowly focused on transactional experiences rather than overall relationship quality.
Best application: Service interactions, digital self-service experiences, and situations where friction reduction directly impacts retention.
c) Customer Satisfaction (CSAT)
CSAT measures customer satisfaction with specific interactions or aspects of the experience.
Strengths: Highly adaptable to different touchpoints, provides immediate feedback on specific experience elements.
Limitations: Subject to contextual bias, tends to measure rational rather than emotional aspects of experience.
Best application: Touchpoint-specific measurement, product and feature satisfaction tracking.
d) Customer Lifetime Value (CLV)
CLV calculates the total worth of a customer to a business over the entire relationship.
Strengths: Directly connects CX to financial outcomes, enables segmentation by customer value.
Limitations: Complex to calculate accurately, requires significant data integration.
Best application: Investment prioritization, segmentation strategies, retention program ROI assessment.
2. Building a Multi-Metric Measurement Framework
Forward-thinking organizations are developing integrated measurement systems rather than relying on single metrics:
a) Journey-Based Measurement
Leading organizations map metrics to specific stages of the customer journey:
Acquisition stage: Marketing qualified leads, cost per acquisition, first purchase experience metrics
Onboarding stage: Time to value, CES for setup processes, early usage patterns
Growth stage: Cross-sell/upsell acceptance, share of wallet, engagement metrics
Maturity stage: NPS, renewal rates, advocacy behaviors
Example: Adobe's Experience Cloud implementation team uses journey-based measurement to track onboarding success. They discovered that customers who completed implementation within 60 days showed 3.2x higher renewal rates, leading them to redesign their onboarding experience around this critical milestone.
b) Balanced Scorecard Approach
High-performing CX organizations balance four types of metrics:
Perception metrics: How customers feel (NPS, CSAT)
Descriptive metrics: What happened (completion rates, usage statistics)
Outcome metrics: Business results (retention, growth, referrals)
Driver metrics: Factors influencing other metrics (response time, error rates)
Example: Intuit's TurboTax team uses a balanced CX scorecard that demonstrated a significant relationship between first-year ease of use (measured by CES) and second-year retention rates, leading to major UX investments that increased retention by 5% year-over-year.
c) Predictive Modeling
Advanced organizations use statistical modeling to identify which metrics best predict desired business outcomes:
Regression analysis: Determining which experience factors most influence retention
Signal detection: Identifying metric thresholds that predict churn risk
Attribution modeling: Understanding how multiple touchpoints contribute to outcomes
Example: Telecommunications provider T-Mobile developed predictive models revealing that first-call resolution was their strongest retention predictor—more so than overall satisfaction. This insight drove process changes reducing transfer rates by 27% and increasing retention by 4%.
3. Implementation Best Practices
Successfully implementing CX metrics requires more than just collecting data:
a) Governance and Accountability
Metric ownership: Assigning executive sponsors for key metrics
Incentive alignment: Tying compensation to CX performance
Regular review cadence: Establishing forums for metric analysis
Example: Insurance company USAA ties 25% of executive compensation to CX metrics, creating organizational alignment around customer outcomes that has helped them maintain industry-leading retention rates exceeding 97%.
b) Feedback Velocity
Real-time alerting: Enabling immediate response to negative experiences
Closed-loop processes: Following up with customers after feedback
Continuous collection: Moving beyond periodic surveying to ongoing measurement
Example: Enterprise software company Atlassian implemented real-time CES monitoring with automated alerts, allowing them to resolve 76% of negative experiences within 24 hours and convert 31% of detractors to promoters.
c) Democratization of Insights
Self-service dashboards: Making metrics accessible across the organization
Frontline empowerment: Providing teams with actionable customer feedback
Cross-functional sharing: Breaking down metric silos between departments
Example: Financial services firm Charles Schwab created an organization-wide "Voice of Client" platform giving all employees access to CX metrics and verbatim feedback. This democratization of insights led to over 400 grassroots experience improvements in the first year.
Conclusion: The Future of CX Measurement
The most effective CX measurement approaches recognize that no single metric tells the complete story. As customer journeys become increasingly complex and digital interactions multiply, measurement systems must evolve to capture both rational and emotional aspects of experience across channels and over time.
The organizations seeing the greatest impact from their CX investments are those that have moved beyond metric obsession to insight action—using complementary measures to identify specific improvement opportunities and track their business impact.
As machine learning and artificial intelligence continue to mature, the next frontier in CX measurement will be predictive experience management—identifying at-risk customers before they churn and proactively addressing experience gaps before they impact customer relationships.
Call to Action
For CX leaders looking to evolve their measurement approaches:
- Audit your current metrics to identify gaps in journey coverage and business alignment
- Develop hypotheses about which aspects of your customer experience most strongly drive desired outcomes
- Test different metrics to determine which best predict customer behavior in your specific context
- Create cross-functional metric ownership to drive accountability for experience improvement
- Focus on speed-to-insight by reducing the time between customer feedback and action
- Invest in capabilities to connect CX metrics to financial outcomes, making the business case for experience investments
The true value of CX metrics lies not in the numbers themselves but in the insights and actions they inspire. By developing a thoughtful, multi-metric approach tailored to your specific customer journeys and business model, you can transform measurement from a reporting exercise into a powerful engine for customer-centered growth.
Featured Blogs
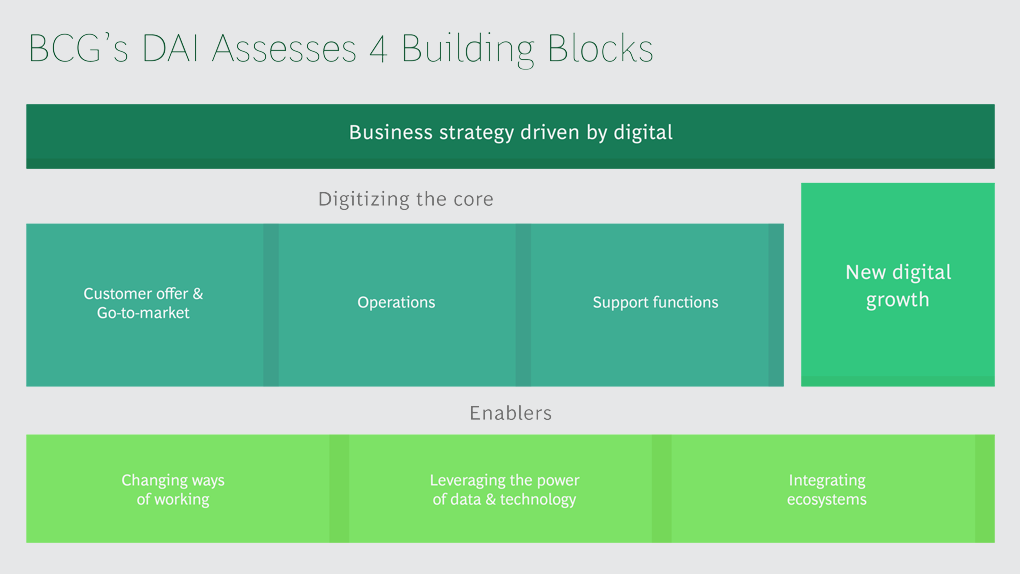
BCG Digital Acceleration Index
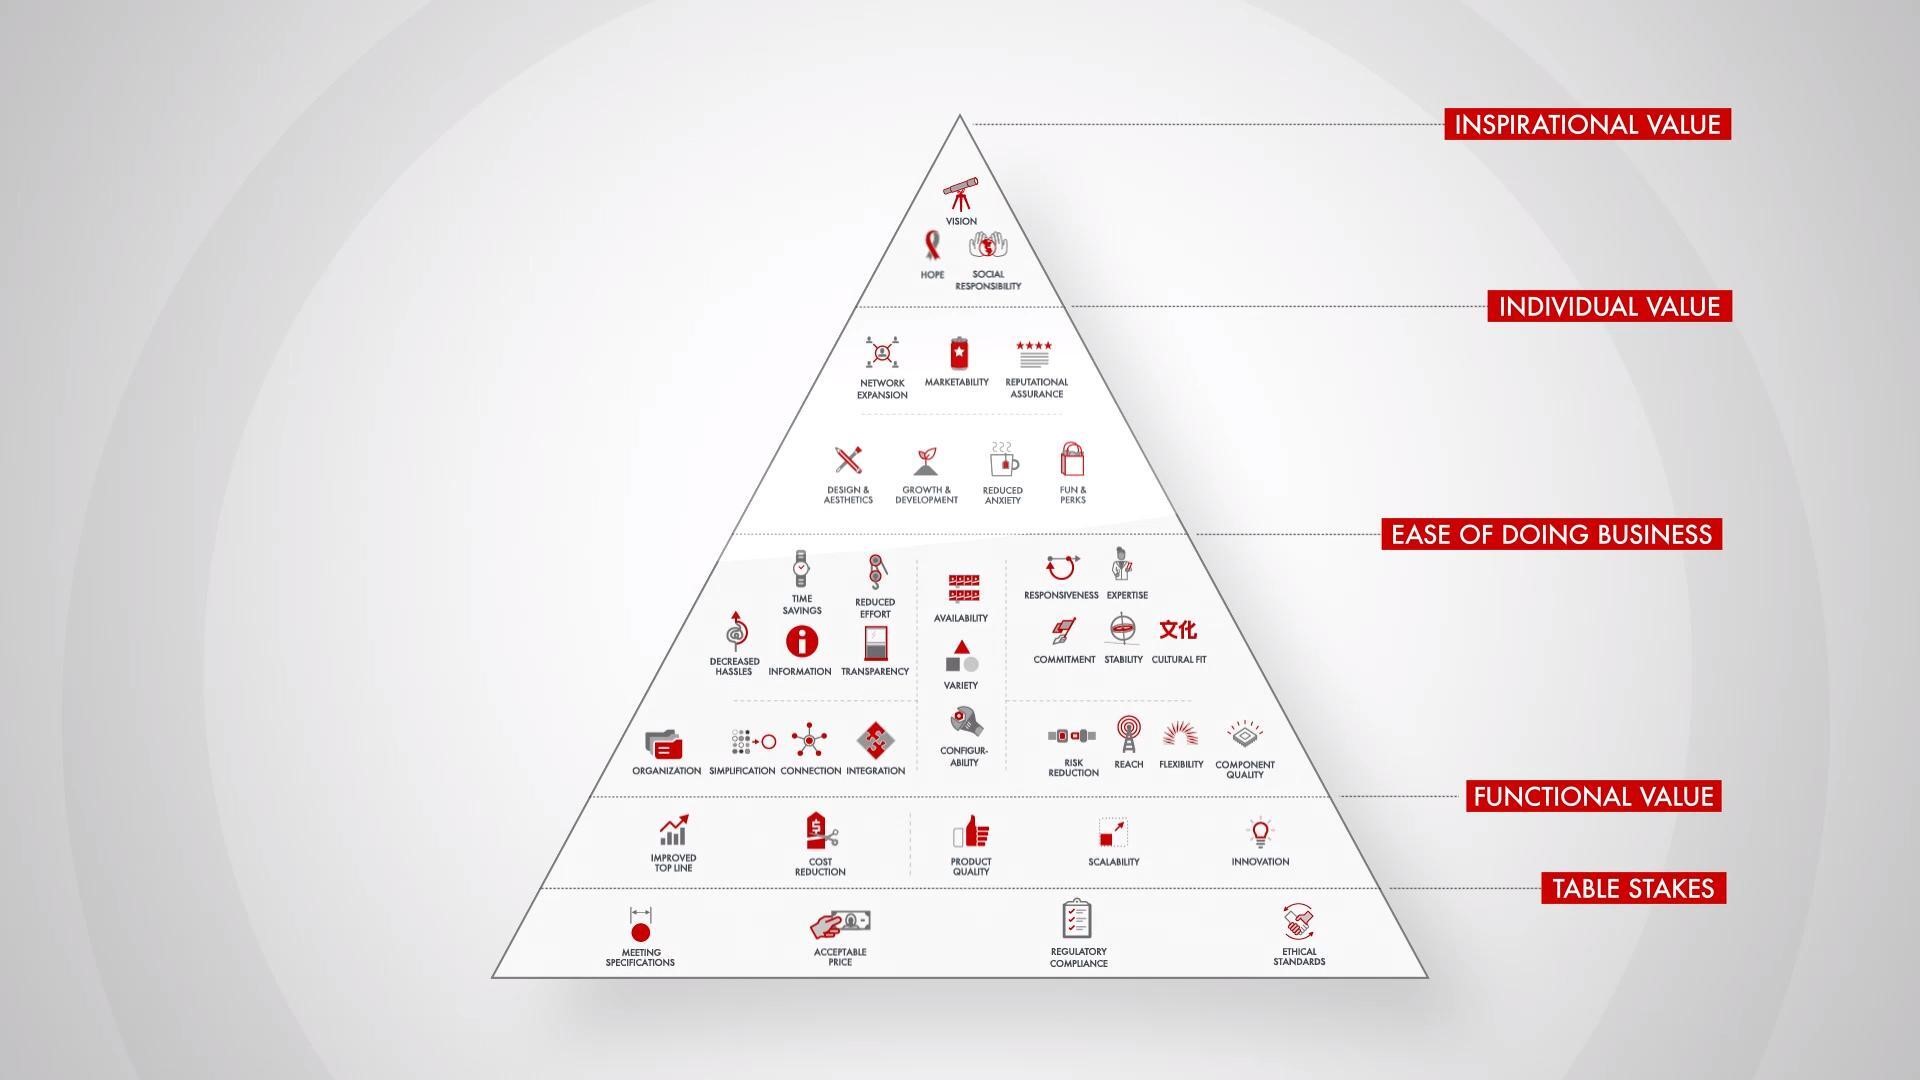
Bain’s Elements of Value Framework
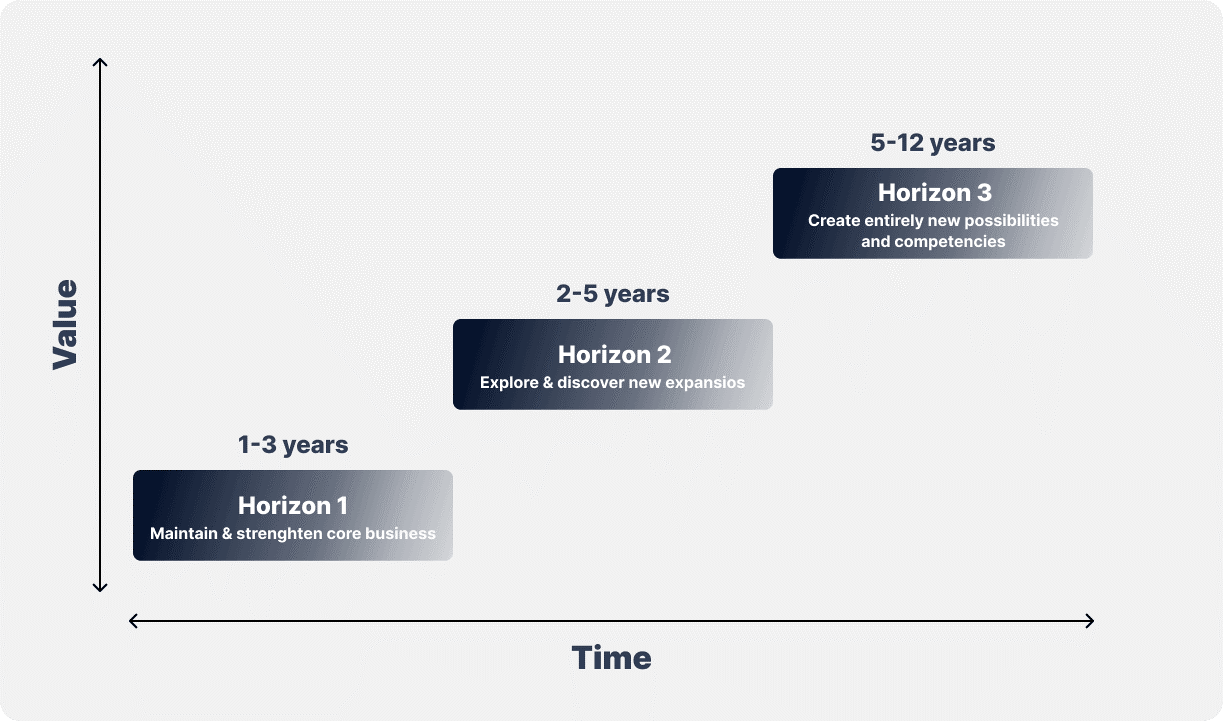
McKinsey Growth Pyramid
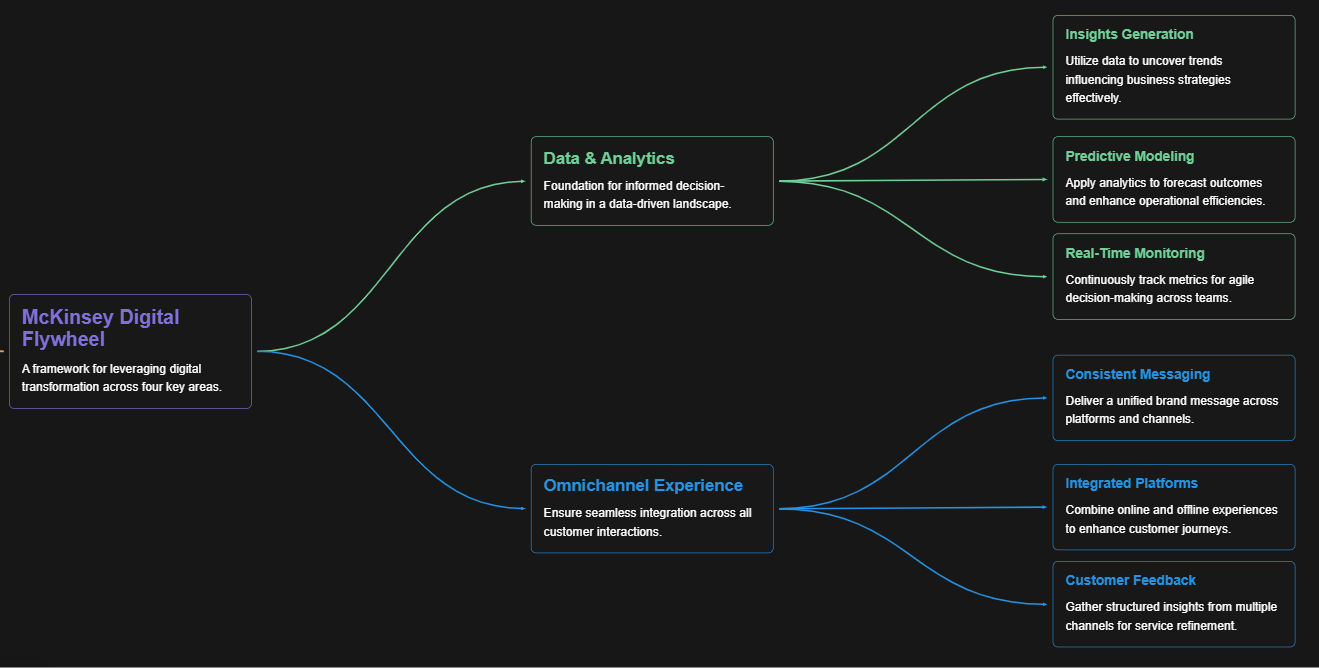
McKinsey Digital Flywheel
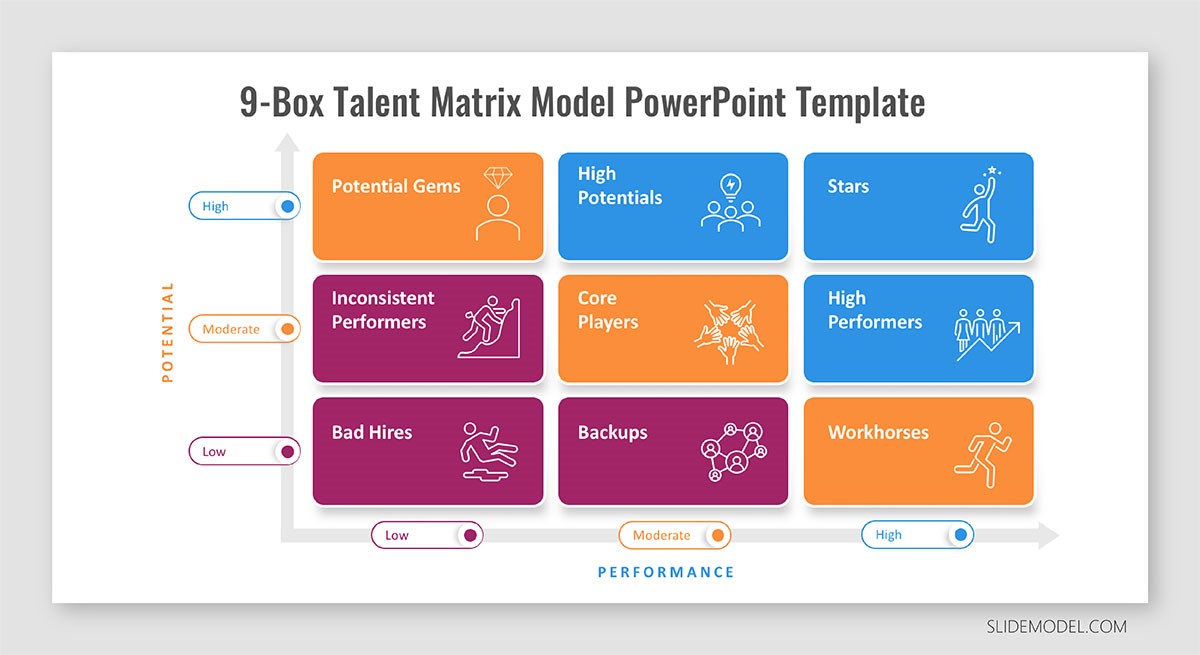
McKinsey 9-Box Talent Matrix
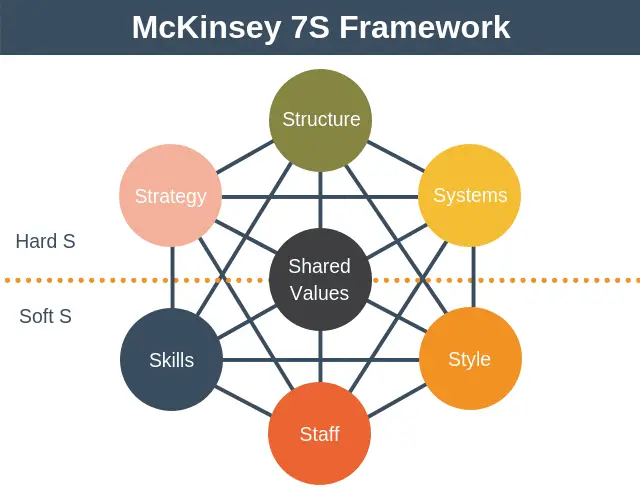
McKinsey 7S Framework
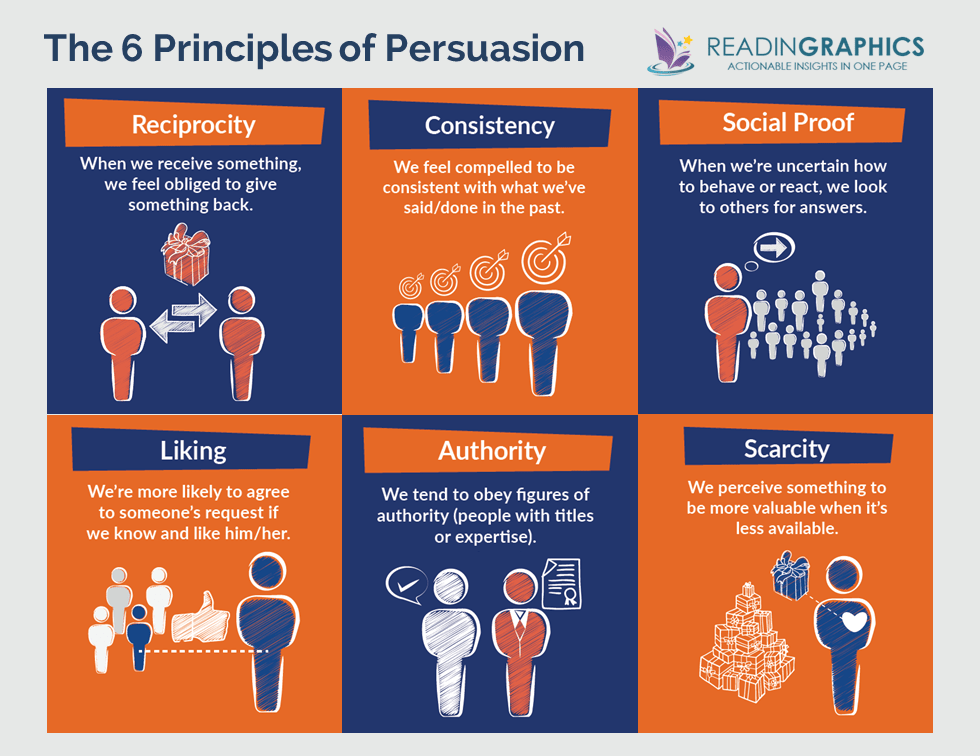
The Psychology of Persuasion in Marketing

The Influence of Colors on Branding and Marketing Psychology


