How to Interpret Statistical Significance in Marketing Terms
Last month, over coffee, Neeraj's former colleague James shared his frustration about a recent campaign dilemma. "We ran an A/B test that showed a 12% lift in conversion rates," James explained, "but my CMO keeps asking if it's 'statistically significant' and whether we should roll it out. I'm not sure how to translate these p-values and confidence intervals into actual business recommendations." James's experience reminded Neeraj how often marketers struggle with bridging the gap between statistical analysis and business decision-making, despite its critical importance to effective marketing strategy.
Introduction: The Translation Challenge
Marketing decisions increasingly rely on data-driven insights, but the language of statistics often creates a communication barrier between analysts and decision-makers. Understanding statistical significance isn't merely academic—it represents the difference between acting on meaningful patterns versus random noise, potentially saving organizations from costly missteps based on illusory results.
Research from the Marketing Science Institute reveals that 68% of marketing executives acknowledge difficulty interpreting statistical analyses, while 74% admit making decisions based on results they didn't fully understand. Meanwhile, a Harvard Business Review analysis found that misinterpreting statistical significance contributes to approximately 30% of ineffective marketing expenditures.
As marketing professor Scott Armstrong notes, "The gap between statistical understanding and marketing application remains one of the most consistent barriers to evidence-based marketing decisions." Bridging this gap requires a clear translation of statistical concepts into marketing terms that drive confident action.
P-values and Confidence Intervals: Your Marketing Decision-Making Tools
P-values represent the probability that your observed marketing result occurred by random chance. In practical terms:
- A p-value of 0.05 (common significance threshold) means there's only a 5% chance your marketing campaign success was random luck
- A p-value of 0.01 means there's just a 1% chance the outcome was coincidental
Confidence intervals provide the range where your true effect likely resides:
- A 95% confidence interval of +8% to +16% conversion improvement means you can reasonably expect results in this range when implementing your campaign broadly
- Wider intervals signal less precision—a 95% confidence interval of -5% to +25% suggests high variability in potential outcomes
For example, when retail brand Nordstrom tested new product recommendation algorithms, they required p-values below 0.05 and narrow confidence intervals before implementation. This disciplined approach led to a demonstrable 23% increase in cross-selling success while avoiding changes that showed promising averages but failed statistical rigor.
Business Meaning of "Significant": Beyond Statistics
Statistical significance doesn't automatically equal business significance. Consider:
- Effect size matters more than p-values: A statistically significant 0.1% improvement in conversion rates may not justify implementation costs
- Practical significance framework: Calculate the minimum effect size needed to achieve ROI given implementation costs
- Segment-specific significance: Results significant for your overall audience may not apply equally across customer segments
The marketing team at software company Adobe developed a "Minimum Commercially Viable Improvement" metric that calculates the smallest statistically significant change that justifies deployment costs. This approach helped them prioritize user experience improvements that delivered 3.2x higher ROI than previous methods that focused solely on statistical significance.
When Not to Trust Results: Red Flags for Marketers
Several situations warrant skepticism despite apparent statistical significance:
- Multiple testing problems: When running numerous tests (common in multivariate testing), some will appear significant by chance alone
- Small sample sizes: Tests with few participants may show statistical significance but lack reliability for broader implementation
- Selection bias: When your test group doesn't represent your actual customer base
- Short measurement periods: Results that don't account for time-based variables or seasonality
Financial services company Capital One discovered a seemingly successful email campaign (p < 0.01) actually performed poorly when implemented broadly. Post-analysis revealed their test coincided with an unrelated PR event that temporarily boosted engagement, creating a false statistical signal. They now employ mandatory "external factor analysis" before accepting test results.
Conclusion: Statistical Literacy as Marketing Advantage
As marketing environments grow increasingly complex, statistical literacy becomes a competitive differentiator. Organizations that properly interpret statistical significance make more effective resource allocations, avoid costly misinterpretations, and build genuinely data-driven cultures. The most successful marketing organizations develop frameworks that translate statistical concepts into business language while maintaining appropriate rigor.
The future of marketing effectiveness depends not just on collecting data but on interpreting it correctly—transforming statistical significance from a technical hurdle into a strategic advantage that drives genuine market impact.
Call to Action
Elevate your organization's statistical literacy through these actionable steps:
- Develop a "statistical translation guide" specific to your company's marketing metrics
- Establish clear thresholds for both statistical and business significance before running tests
- Create cross-functional review processes that include both analysts and business stakeholders
- Invest in accessible statistical training for marketing decision-makers
- Build a test-and-learn culture that values both statistical rigor and business relevance
Remember that the goal isn't statistical purity but better business decisions—the true measure of statistical understanding in marketing isn't technical mastery but improved market performance.
Featured Blogs
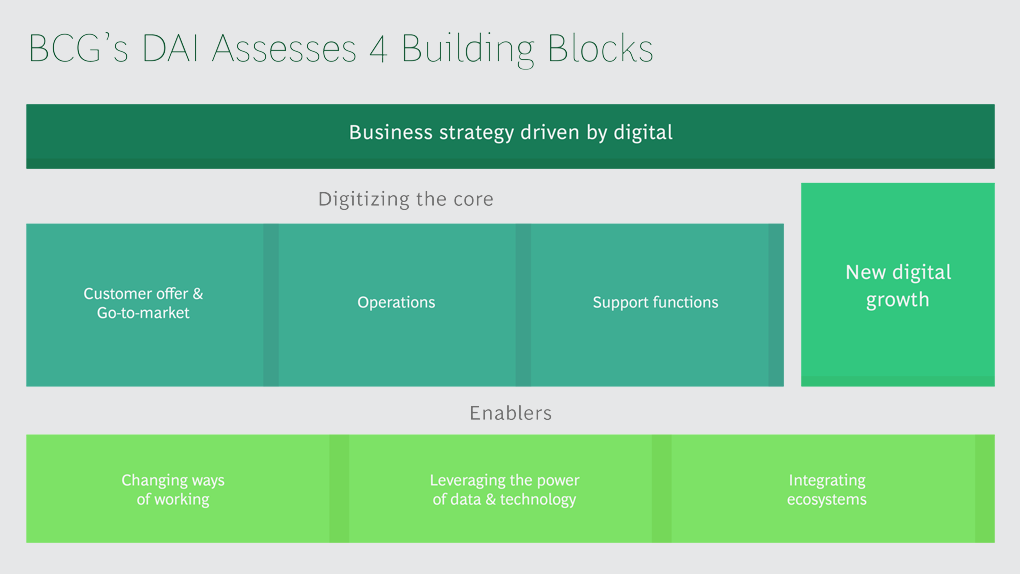
BCG Digital Acceleration Index
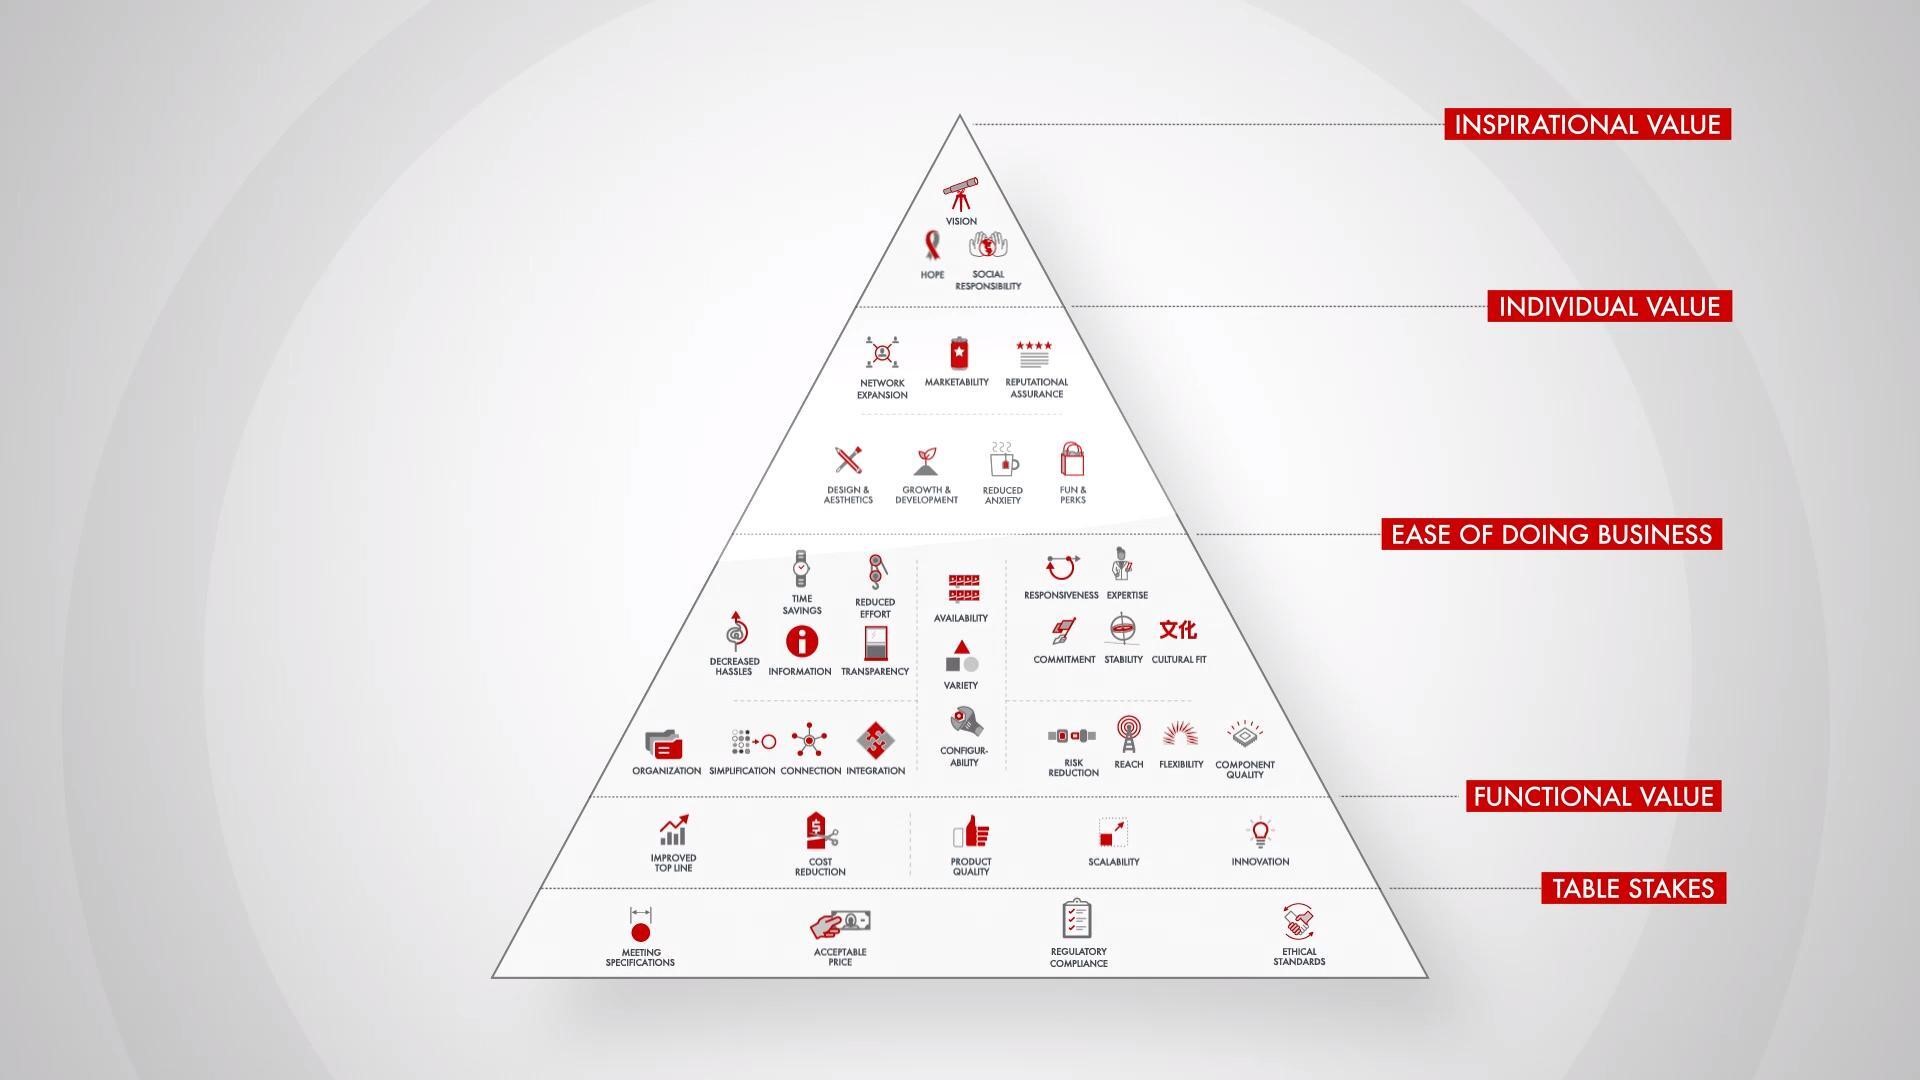
Bain’s Elements of Value Framework
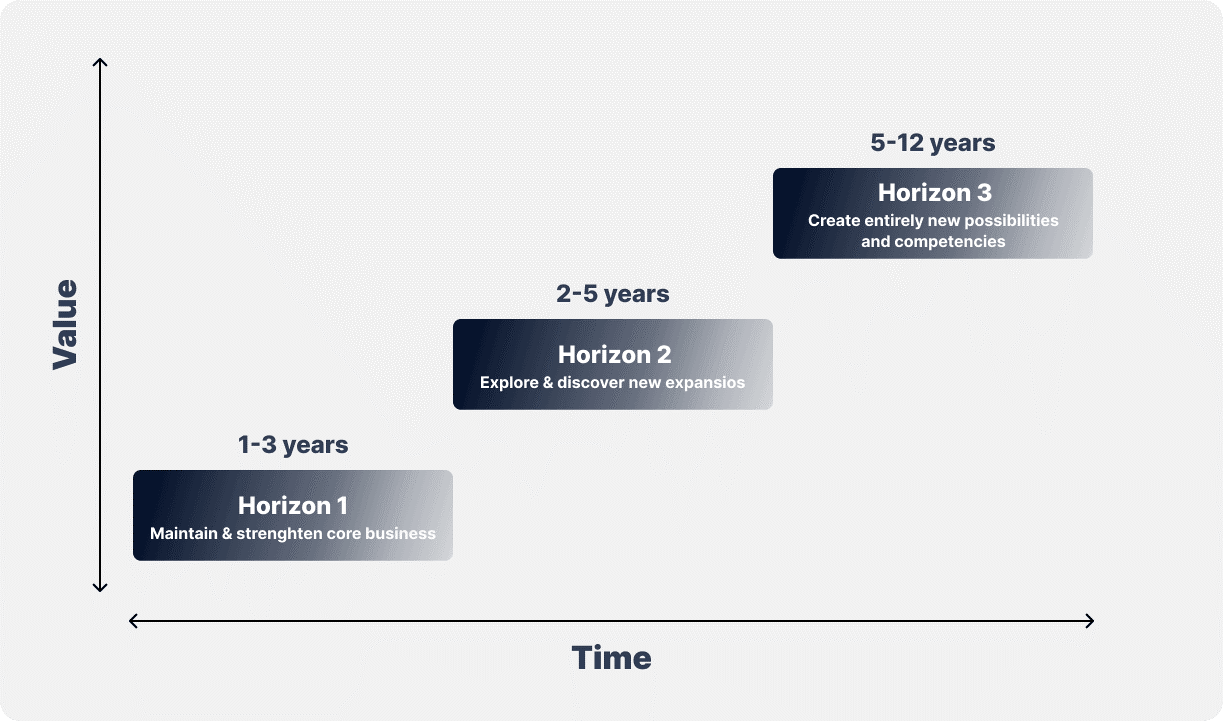
McKinsey Growth Pyramid
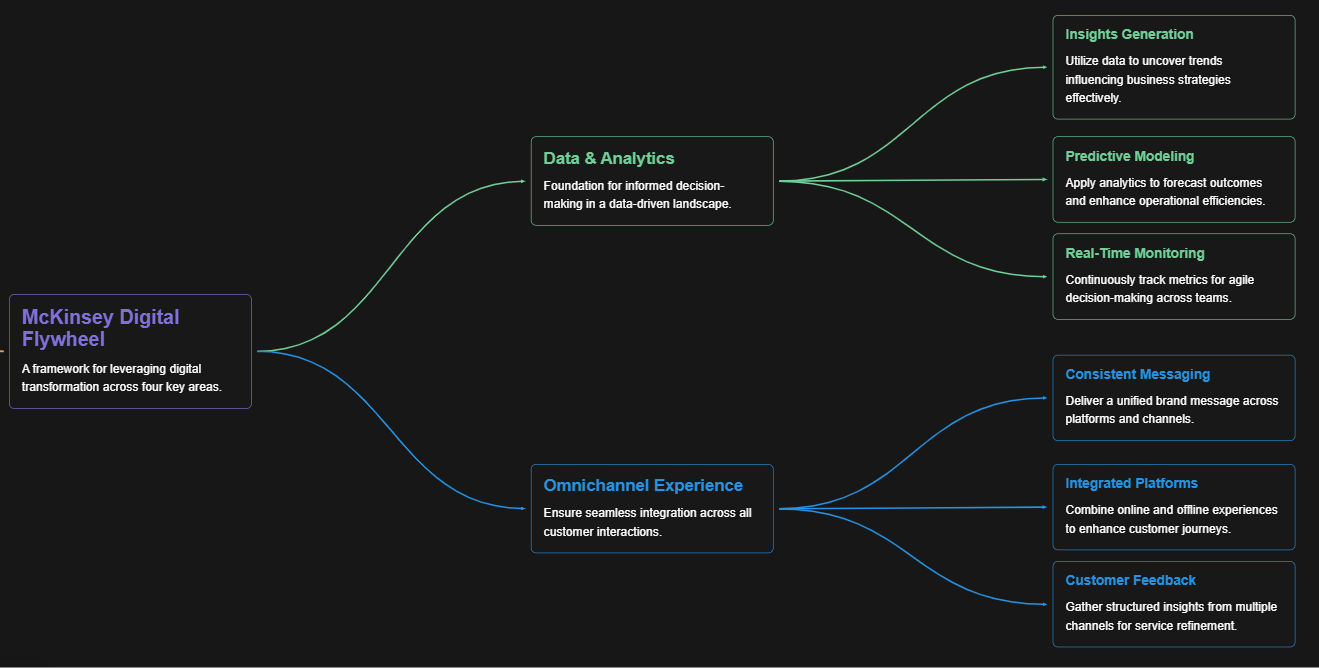
McKinsey Digital Flywheel
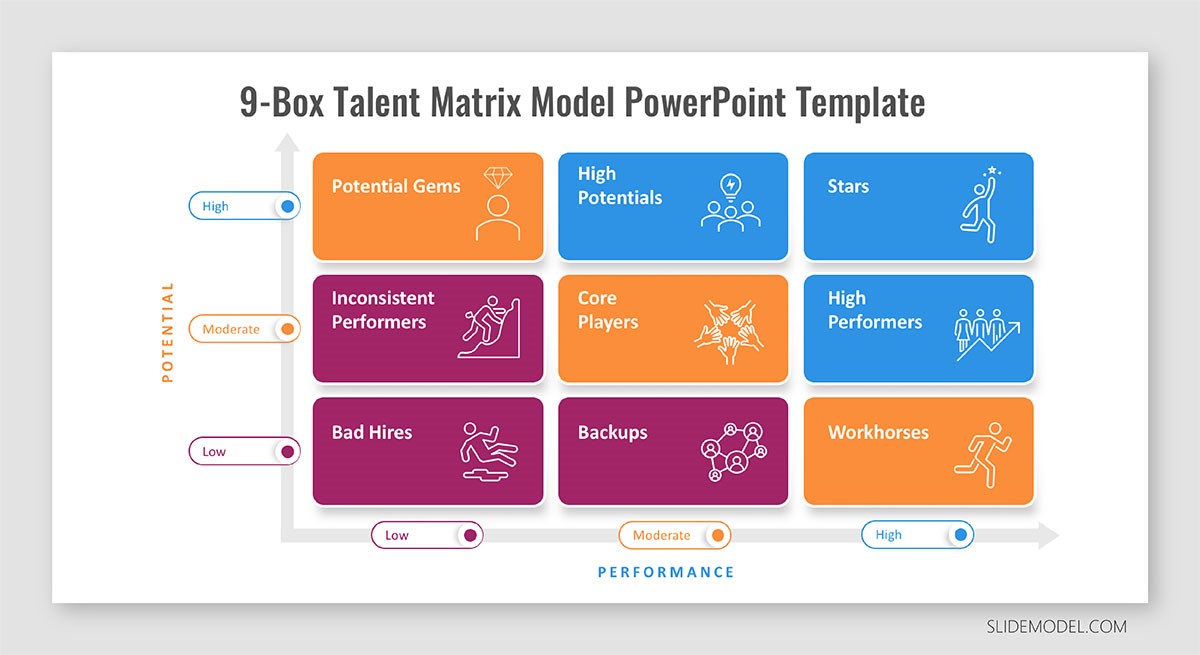
McKinsey 9-Box Talent Matrix

McKinsey 7S Framework
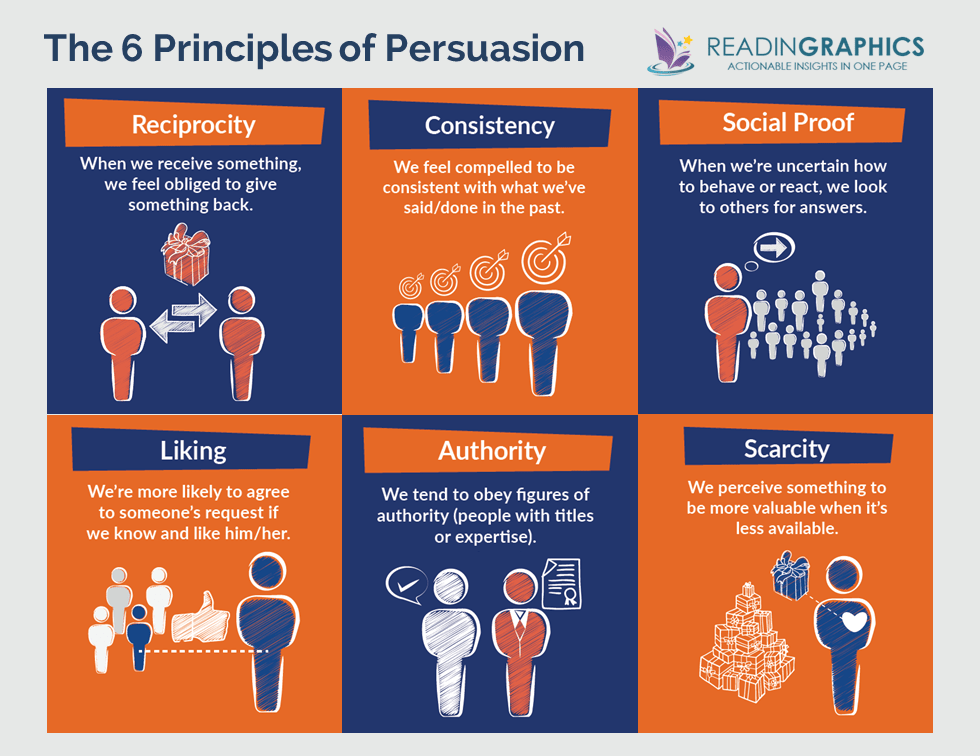
The Psychology of Persuasion in Marketing
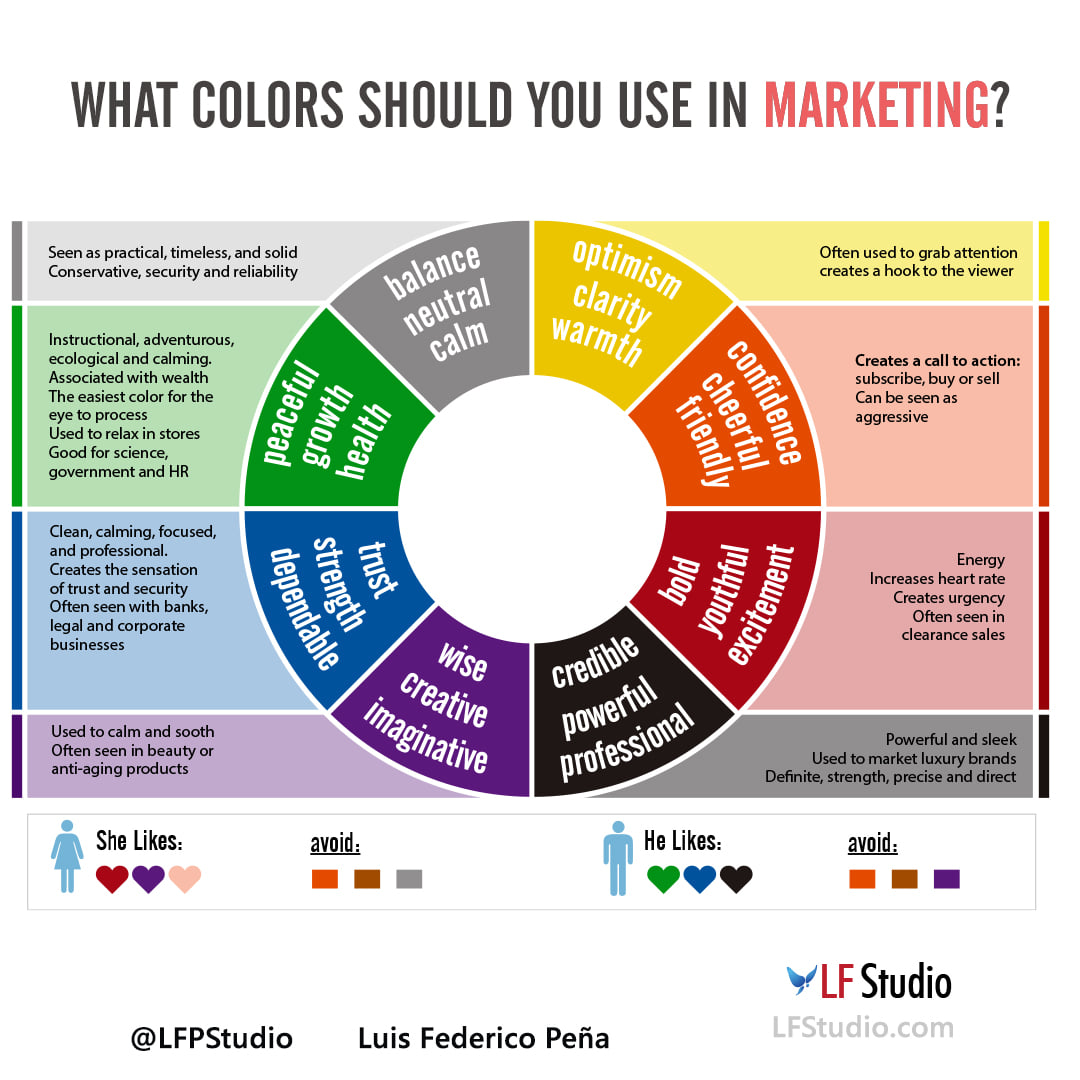
The Influence of Colors on Branding and Marketing Psychology


