Demystifying SHAP: Making Machine Learning Models Explainable and Trustworthy
What is SHAP?
Shapley Additive Explanations (SHAP) is a powerful framework designed to bring transparency to machine learning. In an era where models increasingly influence high-stakes decisions—from approving loans to diagnosing patients—accuracy alone is no longer sufficient. Stakeholders demand to know not just what a model predicts, but why it made that prediction.
SHAP bridges this gap. By quantifying the contribution of each input feature to a specific prediction, SHAP transforms black-box models into interpretable partners for business, finance, healthcare, and beyond. Whether you’re classifying high-value leads, predicting customer churn, or forecasting demand, SHAP translates complex model logic into insights that decision-makers can trust.
Why Does SHAP Matter?
Many machine learning models operate as black boxes, delivering results without explanations. This opacity can erode trust and stall adoption, especially when decisions require justification—think of a finance team needing to explain a loan denial, or a healthcare provider justifying a high-risk flag. SHAP addresses this challenge by attributing each prediction to the features that drove it, making the decision process transparent and auditable.
How Does SHAP Work?
Imagine a machine learning model as a team effort, where each feature is a team member contributing to the final result. SHAP fairly distributes "credit" for the prediction among the features, ensuring that:
The sum of all feature contributions equals the model’s output
Irrelevant features receive zero contribution
Explanations are consistent and grounded in solid mathematical principles
With SHAP, machine learning models don’t just predict—they explain, earning trust where it matters most.
Case Study : Uncovering Drivers of Diabetes Risk Using XGBoost and SHAP
In the healthcare domain, accurate prediction and explainability are equally critical—especially when diagnosing chronic conditions like diabetes. In this case study, we explore how a machine learning model built using XGBoost can effectively classify patients based on their likelihood of having diabetes, using clinical and physiological data from the Pima Indians Diabetes Dataset.
While the model provides high predictive accuracy, we go a step further using SHAP (SHapley Additive exPlanations) to break open the black box—offering both global and individual-level explanations that bridge the gap between data science outputs and actionable medical insights.
Code Snippet
import pandas as pd
import xgboost as xgb
import shap
import matplotlib.pyplot as plt
from sklearn.model_selection import train_test_split
from sklearn.metrics import accuracy_score, roc_auc_score

# Load dataset
url = "https://raw.githubusercontent.com/jbrownlee/Datasets/master/pima-indians-diabetes.data.csv"
columns = ['Pregnancies', 'Glucose', 'BloodPressure', 'SkinThickness', 'Insulin',
           'BMI', 'DiabetesPedigreeFunction', 'Age', 'Outcome']
df = pd.read_csv(url, names=columns)

# Define features and target
X = df.drop('Outcome', axis=1)
y = df['Outcome']

# Split into train and test sets
X_train, X_test, y_train, y_test = train_test_split(
    X, y, test_size=0.2, random_state=42
)

# Train XGBoost model
model = xgb.XGBClassifier(use_label_encoder=False, eval_metric='logloss', random_state=42)
model.fit(X_train, y_train)

# Predict and evaluate
y_pred = model.predict(X_test)
y_pred_proba = model.predict_proba(X_test)[:, 1]
print("Accuracy:", accuracy_score(y_test, y_pred))
print("AUC Score:", roc_auc_score(y_test, y_pred_proba))

# -------------------
# XGBoost Feature Importance (baseline)
# -------------------
xgb.plot_importance(model)
plt.title("XGBoost Feature Importance")
plt.show()

# -------------------
# SHAP EXPLAINABILITY
# -------------------

# Initialize SHAP explainer
explainer = shap.Explainer(model, X_train)

# Compute SHAP values for the test set
shap_values = explainer(X_test)

# Summary plot: global feature importance with direction
shap.summary_plot(shap_values, X_test)

# Dependence plot for a specific feature
shap.dependence_plot("Glucose", shap_values.values, X_test)

# Explain one prediction using a waterfall plot
print("Explanation for individual prediction (index 0):")
shap.plots.waterfall(shap_values[0])
XGBoost feature importance tells us which features the model relied on most across all predictions. It gives a global view by ranking features based on how often and how effectively they were used in decision-making. However, it doesn't explain individual predictions — that's where SHAP steps in, offering personalized insights at the row level.


What Types of Models Can Use SHAP?
SHAP works with most major model types:
- Tree-based models (like XGBoost and Random Forest)
- Linear models (like logistic or linear regression)
- Deep learning models
- Even black-box models using kernel methods
If your model is built using scikit-learn, XGBoost, LightGBM, or TensorFlow, SHAP can probably explain it.
Benefits of SHAP
| Benefit | Description |
| Transparency | Turns black-box predictions into understandable outputs |
| Trust | Helps business teams trust the model’s reasoning |
| Insight | Reveals which features are truly driving results |
| Debugging | Flags unexpected or unwanted model behavior |
| Fairness | Detects bias or unintentional discrimination |
Limitations of SHAP
| Limitation | Why It Matters |
| Slower on large models | Complex models take more time to explain |
| Only local explanations | SHAP explains one prediction at a time |
| Assumes feature independence | Can be misleading when features are highly correlated |
| Structured data focused | Special setup needed for images, text, or audio |
Final Thoughts
SHAP is not just a technical tool for data scientists. It’s a powerful bridge between technical predictions and business decision-making.
By providing transparent, consistent explanations, SHAP helps teams:
- Align marketing and data science
- Justify campaigns and strategy shifts
- Focus on the real levers behind performance
In a world where machine learning influences high-stakes decisions, SHAP ensures those decisions are explainable, fair, and based on solid evidence.
Featured Blogs
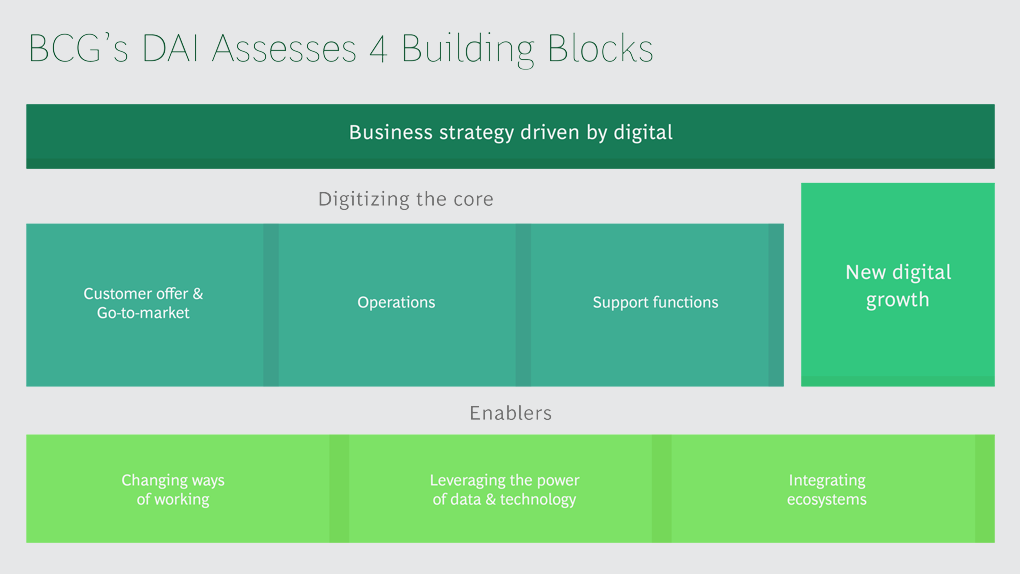
BCG Digital Acceleration Index
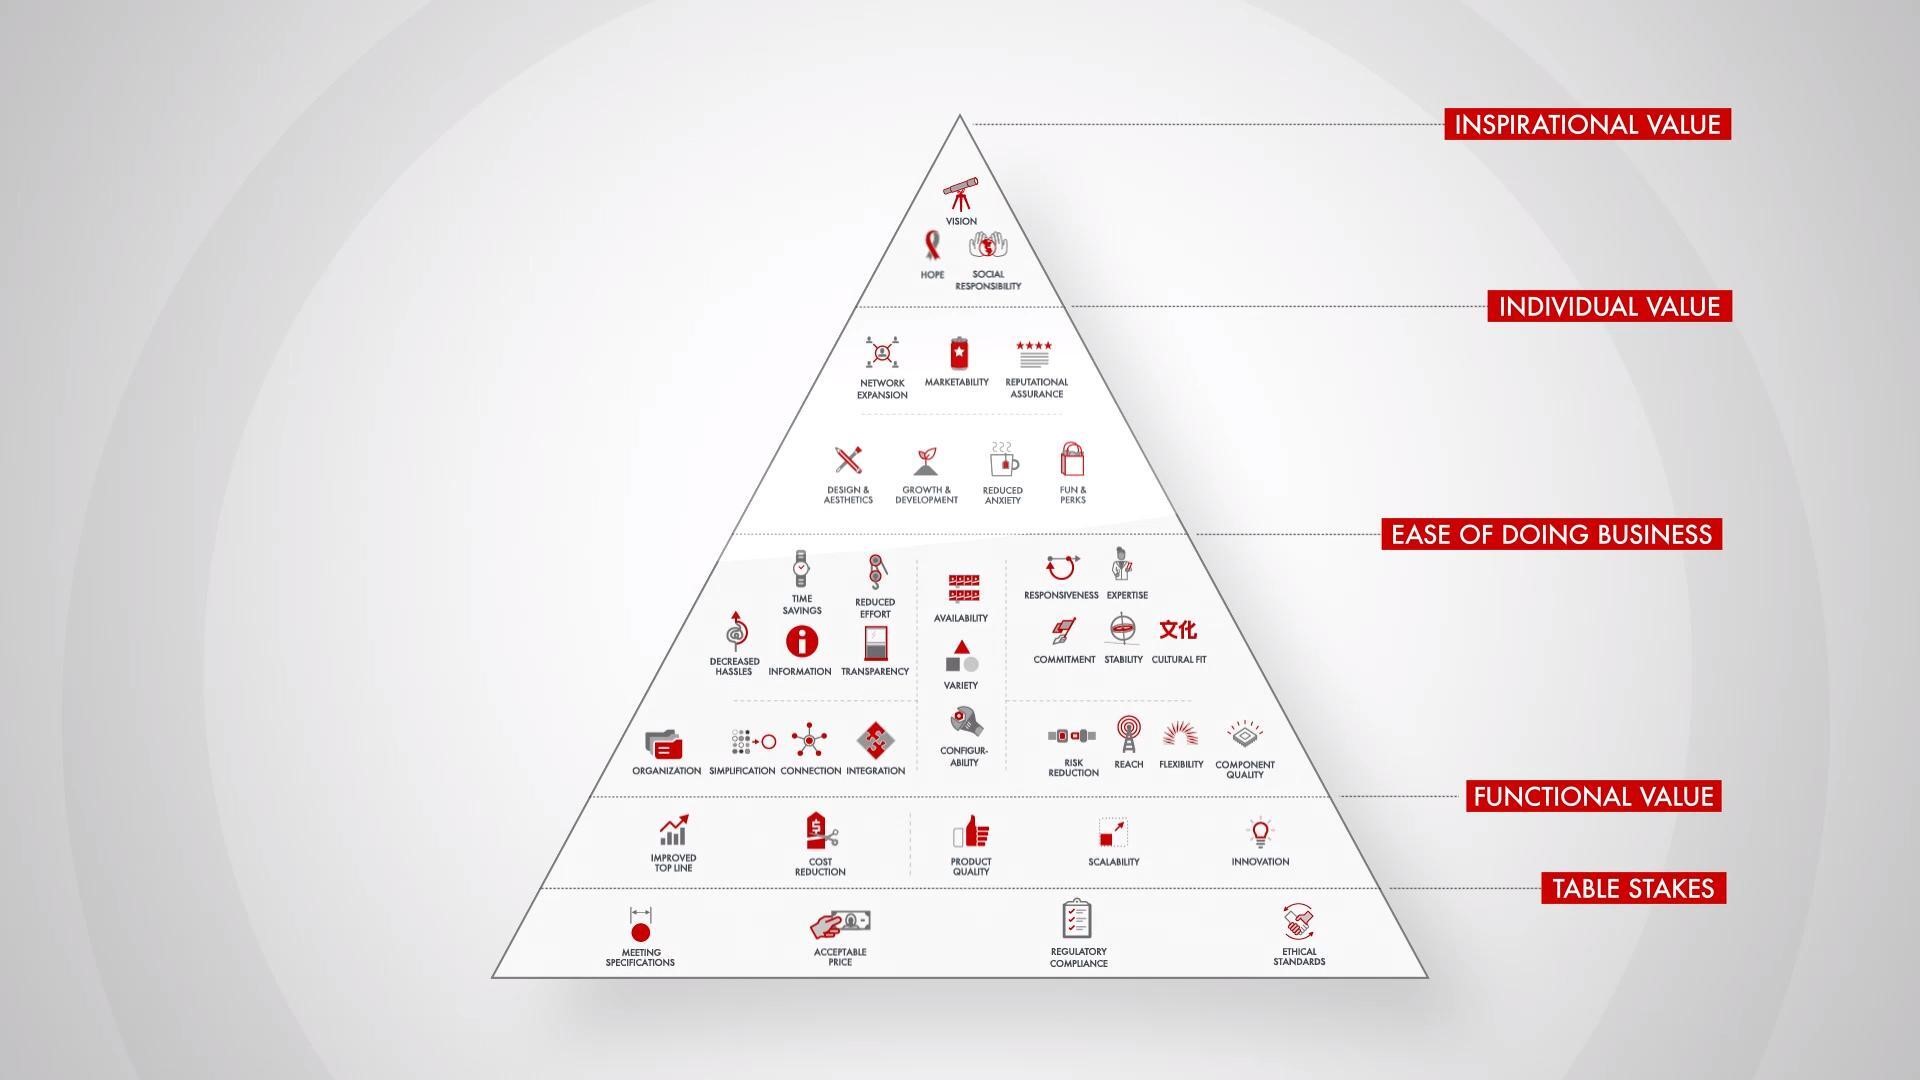
Bain’s Elements of Value Framework
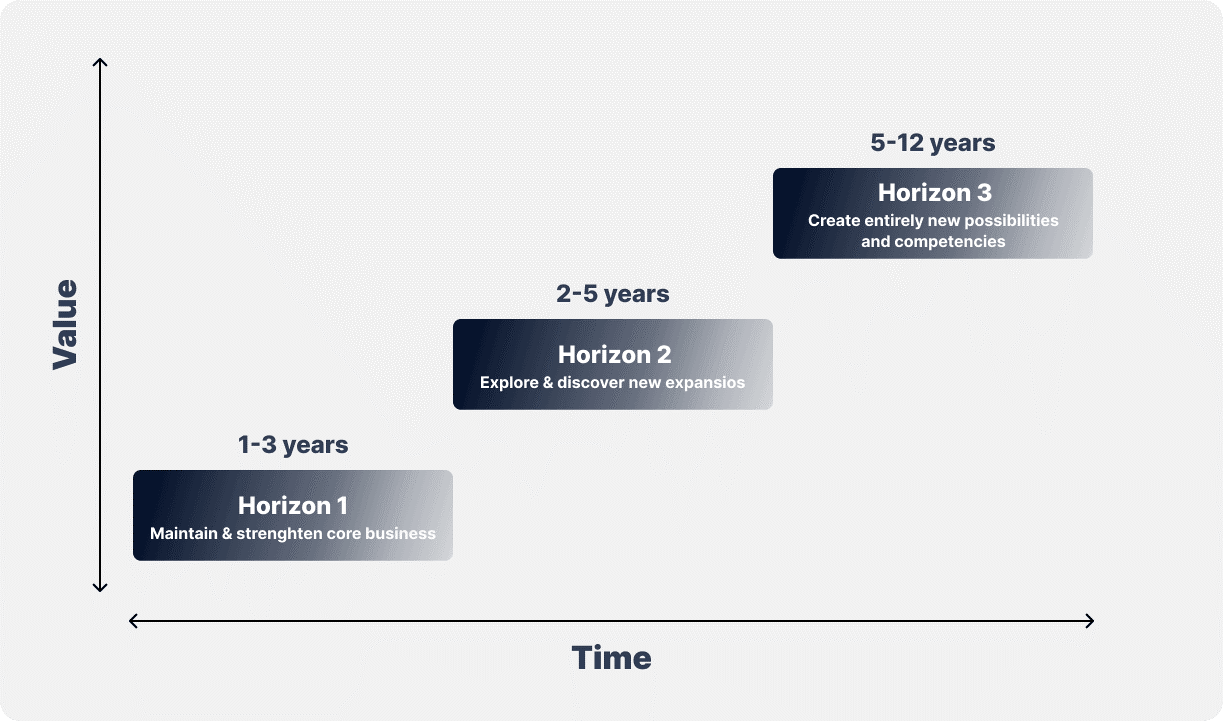
McKinsey Growth Pyramid
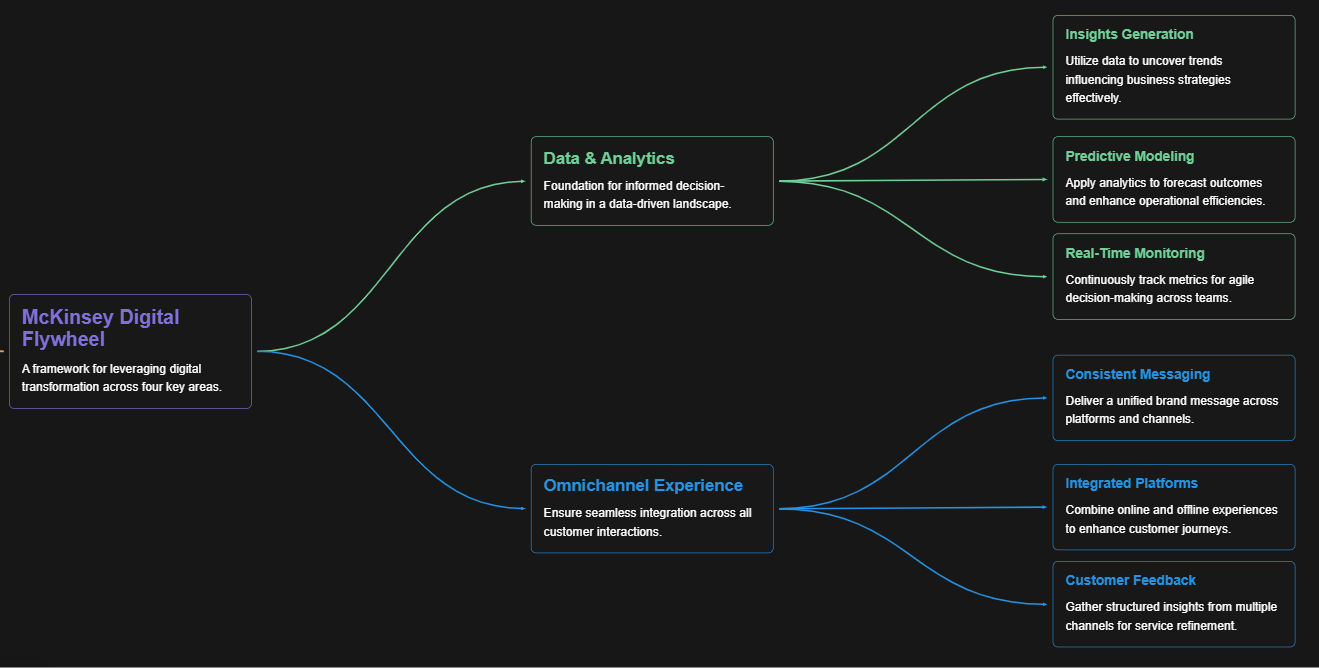
McKinsey Digital Flywheel
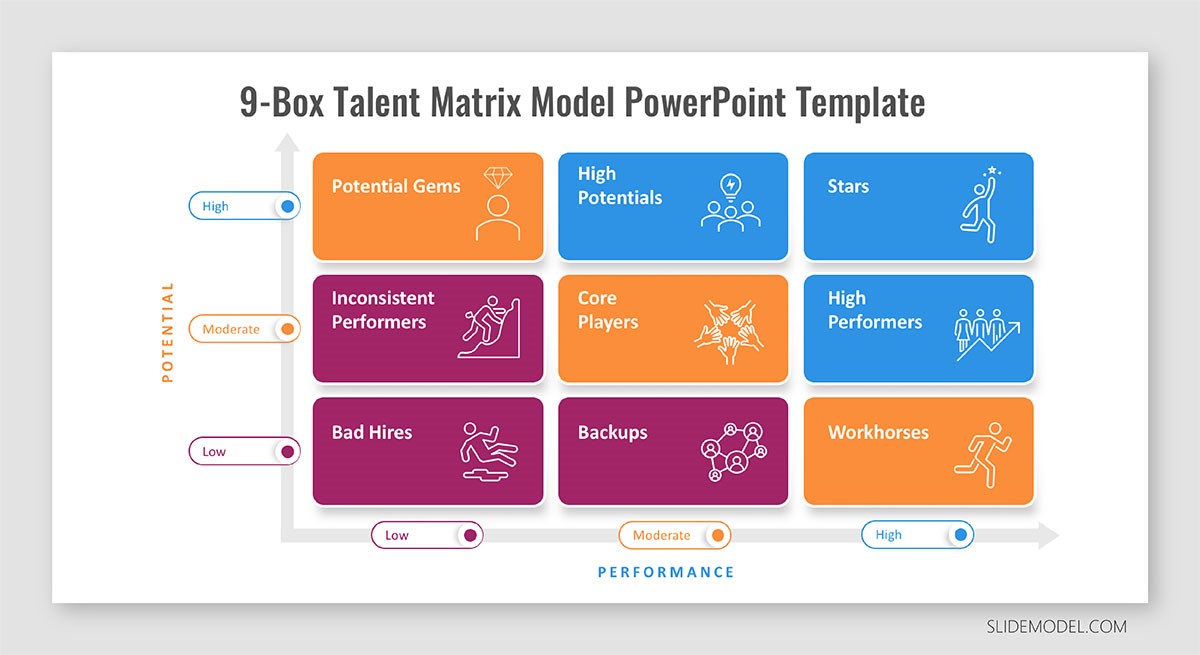
McKinsey 9-Box Talent Matrix

McKinsey 7S Framework
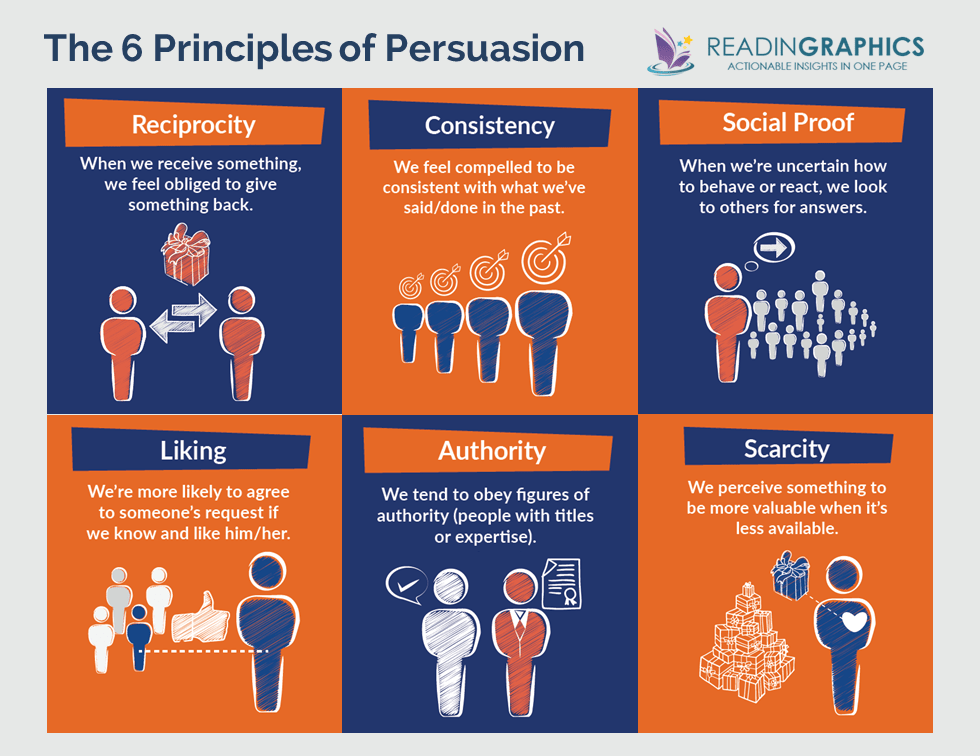
The Psychology of Persuasion in Marketing
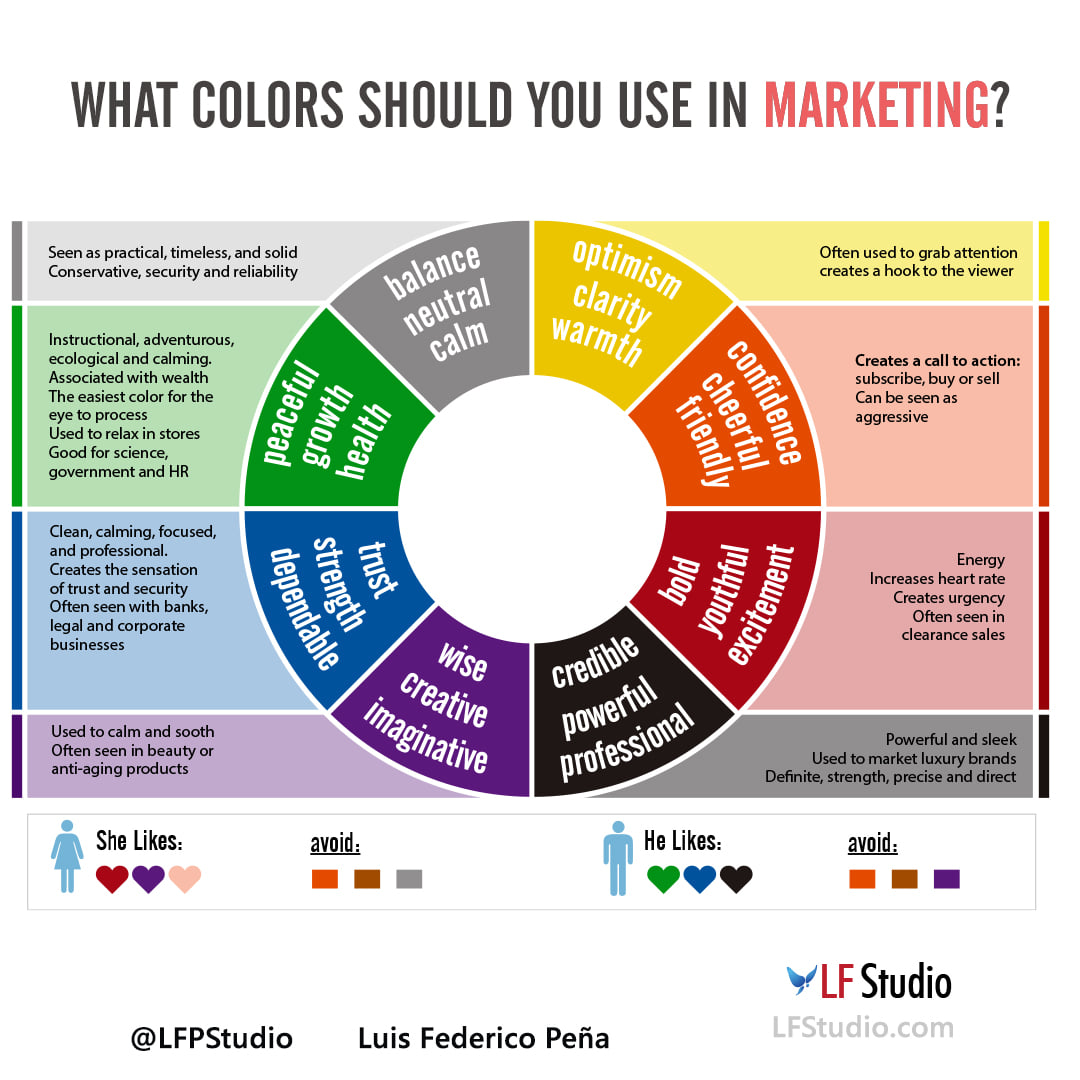
The Influence of Colors on Branding and Marketing Psychology

What is Marketing?
Recent Blogs

Part 8: From Blocks to Brilliance – How Transformers Became Large Language Models (LLMs) of the series - From Sequences to Sentience: Building Blocks of the Transformer Revolution

Part 7: The Power of Now – Parallel Processing in Transformers of the series - From Sequences to Sentience: Building Blocks of the Transformer Revolution
Part 6: The Eyes of the Model – Self-Attention of the series - From Sequences to Sentience: Building Blocks of the Transformer Revolution

Part 5: The Generator – Transformer Decoders of the series - From Sequences to Sentience: Building Blocks of the Transformer Revolution

Part 4: The Comprehender – Transformer Encoders of the series - From Sequences to Sentience: Building Blocks of the Transformer Revolution of the series - From Sequences to Sentience: Building Blocks of the Transformer Revolution


