Digital Dashboards Building vs Buying
I was recently consulting with David, the head of marketing operations at a rapidly scaling B2B software company, when he showed me their current reporting situation. His team was manually creating weekly PowerPoint presentations that took 12 hours to compile, pulling data from 15 different platforms including Google Analytics, Salesforce, HubSpot, Facebook Ads Manager, and their financial systems. By the time these reports reached executive leadership, the data was already outdated, and decisions were being made based on week-old information. David knew they needed real-time visibility across all marketing activities, but he was paralyzed by the choice between building a custom dashboard solution or purchasing an existing platform.
This scenario reflects a critical inflection point that marketing organizations face as they mature and scale. The exponential growth in marketing technology adoption has created unprecedented data richness, but also significant challenges in synthesizing insights from disparate sources. Modern marketing teams interact with an average of 91 different tools according to research from Chiefmartec, creating a complex data ecosystem that requires sophisticated integration and visualization capabilities to deliver actionable insights.
The dashboard decision represents more than just a technology choice; it fundamentally shapes how marketing organizations operate, make decisions, and demonstrate value to stakeholders. Real-time visibility enables agile optimization, proactive problem-solving, and data-driven culture development that can provide significant competitive advantages. However, the technical complexity, resource requirements, and strategic implications of dashboard implementation require careful evaluation of build versus buy alternatives.
1. Real Time Visibility Requirements for Marketing Teams
Modern marketing operations demand immediate access to performance data across all channels and customer touchpoints. Real-time visibility enables marketing teams to identify emerging trends, respond to campaign performance issues, and capitalize on optimization opportunities before they become significant problems. The velocity of digital marketing requires decision-making cycles measured in hours rather than days, making traditional weekly or monthly reporting cycles insufficient for competitive advantage.
Effective real-time dashboards must integrate data from multiple sources while maintaining accuracy and consistency. Marketing automation platforms, advertising networks, web analytics tools, customer relationship management systems, and financial platforms all contribute essential data elements that must be synthesized into coherent performance narratives. The integration challenge extends beyond simple data aggregation to include metric standardization, attribution alignment, and temporal synchronization across systems with different reporting capabilities.
Cross-functional visibility requirements add complexity to dashboard design and implementation. Sales teams need lead quality and conversion metrics, executive leadership requires financial performance indicators, product teams want user engagement data, and customer success teams need retention and satisfaction metrics. A comprehensive dashboard must serve multiple stakeholder groups while maintaining clarity and avoiding information overload that can impede decision-making effectiveness.
The technical infrastructure for real-time dashboards requires robust data pipelines, efficient processing capabilities, and scalable storage solutions. Application programming interfaces, data warehouses, extract-transform-load processes, and caching mechanisms form the foundation that enables real-time data access. Performance optimization becomes critical as data volumes grow and user adoption increases, requiring careful attention to query efficiency and system architecture.
2. Platform Evaluation and Selection Criteria
Google Data Studio offers a cost-effective entry point for organizations seeking dashboard capabilities without significant technical investment. The platform provides native integration with Google's marketing and analytics ecosystem, including Google Analytics, Google Ads, Google Search Console, and YouTube Analytics. The drag-and-drop interface enables marketers to create visualizations without coding skills, while the collaboration features support team-based dashboard development and sharing.
However, Data Studio limitations become apparent as organizations scale and require more sophisticated functionality. The platform struggles with large datasets, complex calculations, and advanced visualization types. Integration with non-Google platforms requires third-party connectors or custom development, while customization options are limited compared to enterprise solutions. Performance issues can emerge with complex dashboards or high user concurrency.
Tableau represents the premium end of the dashboard market, offering sophisticated data modeling, advanced visualization capabilities, and enterprise-grade performance. The platform excels at handling large datasets, complex calculations, and interactive dashboards that enable deep analytical exploration. Tableau's extensive connector library supports integration with virtually any data source, while the robust developer community provides extensive resources and extensions.
Power BI provides Microsoft-centric organizations with seamless integration into existing technology stacks. The platform offers strong integration with Microsoft Office, Azure cloud services, and SQL Server databases. Power BI's pricing model can be attractive for organizations already invested in Microsoft licensing, while the familiar interface reduces training requirements for teams comfortable with Microsoft applications.
3. Media Sales and Brand Data Integration Strategies
Successful dashboard implementation requires comprehensive integration of media performance data, sales metrics, and brand measurement indicators. Media data encompasses advertising spend, impressions, clicks, conversions, and audience metrics across paid, owned, and earned channels. Sales data includes lead generation, pipeline progression, conversion rates, deal size, and customer lifetime value metrics. Brand data incorporates awareness, consideration, sentiment, and equity measurements that reflect long-term marketing impact.
The integration challenge stems from different data structures, reporting frequencies, and measurement methodologies across these domains. Media platforms report performance in real-time with granular detail, while sales systems typically provide batch updates with different attribution windows. Brand measurement often relies on survey data or third-party research with monthly or quarterly reporting cycles. Harmonizing these different data streams requires careful attention to temporal alignment and metric definitions.
Advanced integration strategies utilize data warehousing solutions that centralize all marketing and business data in a single repository. Cloud-based platforms like Snowflake, Amazon Redshift, and Google BigQuery provide scalable storage and processing capabilities that can handle complex integration requirements. These solutions enable sophisticated data modeling that creates unified customer views and consistent metric definitions across all dashboard components.
API-first architecture enables flexible data integration that can adapt to changing technology stacks and business requirements. Modern dashboard platforms provide extensive API capabilities that support custom integrations, automated data updates, and programmatic dashboard management. This approach reduces dependence on manual data processes and enables more sophisticated automation workflows.
Case Study: SaaS Company's Dashboard Transformation
A fast-growing Software-as-a-Service company was struggling with fragmented reporting across their marketing, sales, and customer success organizations. Each department maintained separate dashboards and used different metrics, leading to conflicting performance narratives and suboptimal decision-making. The marketing team used Google Analytics and HubSpot reports, sales relied on Salesforce dashboards, and customer success tracked metrics in their support platform.
The company decided to implement a comprehensive dashboard solution that would provide unified visibility across all customer lifecycle stages. After evaluating build versus buy options, they selected Tableau as their primary visualization platform integrated with Snowflake as their data warehouse. This combination provided the analytical power they needed while leveraging existing cloud infrastructure investments.
The implementation process involved consolidating data from 12 different platforms into a centralized data warehouse with standardized metrics and definitions. They created role-based dashboards that provided appropriate visibility for different stakeholder groups while maintaining data consistency. The marketing dashboard integrated advertising spend and performance data with lead generation and sales conversion metrics. The executive dashboard provided high-level business performance indicators with drill-down capabilities for detailed analysis.
The results exceeded expectations across multiple dimensions. Report creation time decreased from 12 hours weekly to real-time availability, while data accuracy improved through automated validation processes. Cross-functional alignment improved as all teams worked from the same performance metrics and definitions. Most importantly, the ability to identify and respond to performance issues in real-time contributed to a 34% improvement in marketing efficiency and 28% faster sales cycle progression.
Call to Action
For marketing leaders evaluating dashboard solutions, begin by conducting a comprehensive audit of your current reporting processes and identifying the true cost of manual data compilation and delayed insights. Define clear requirements for real-time visibility, cross-functional integration, and scalability that align with your organization's growth trajectory. Consider starting with a pilot implementation that demonstrates value before committing to large-scale platform deployment, and ensure your chosen solution can evolve with your expanding data and analytical requirements.
Featured Blogs
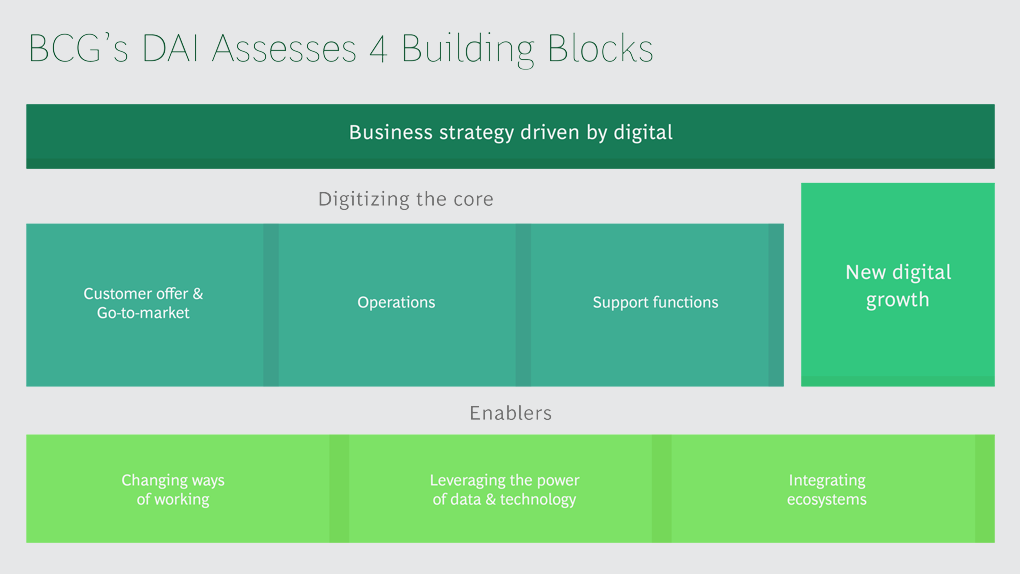
BCG Digital Acceleration Index
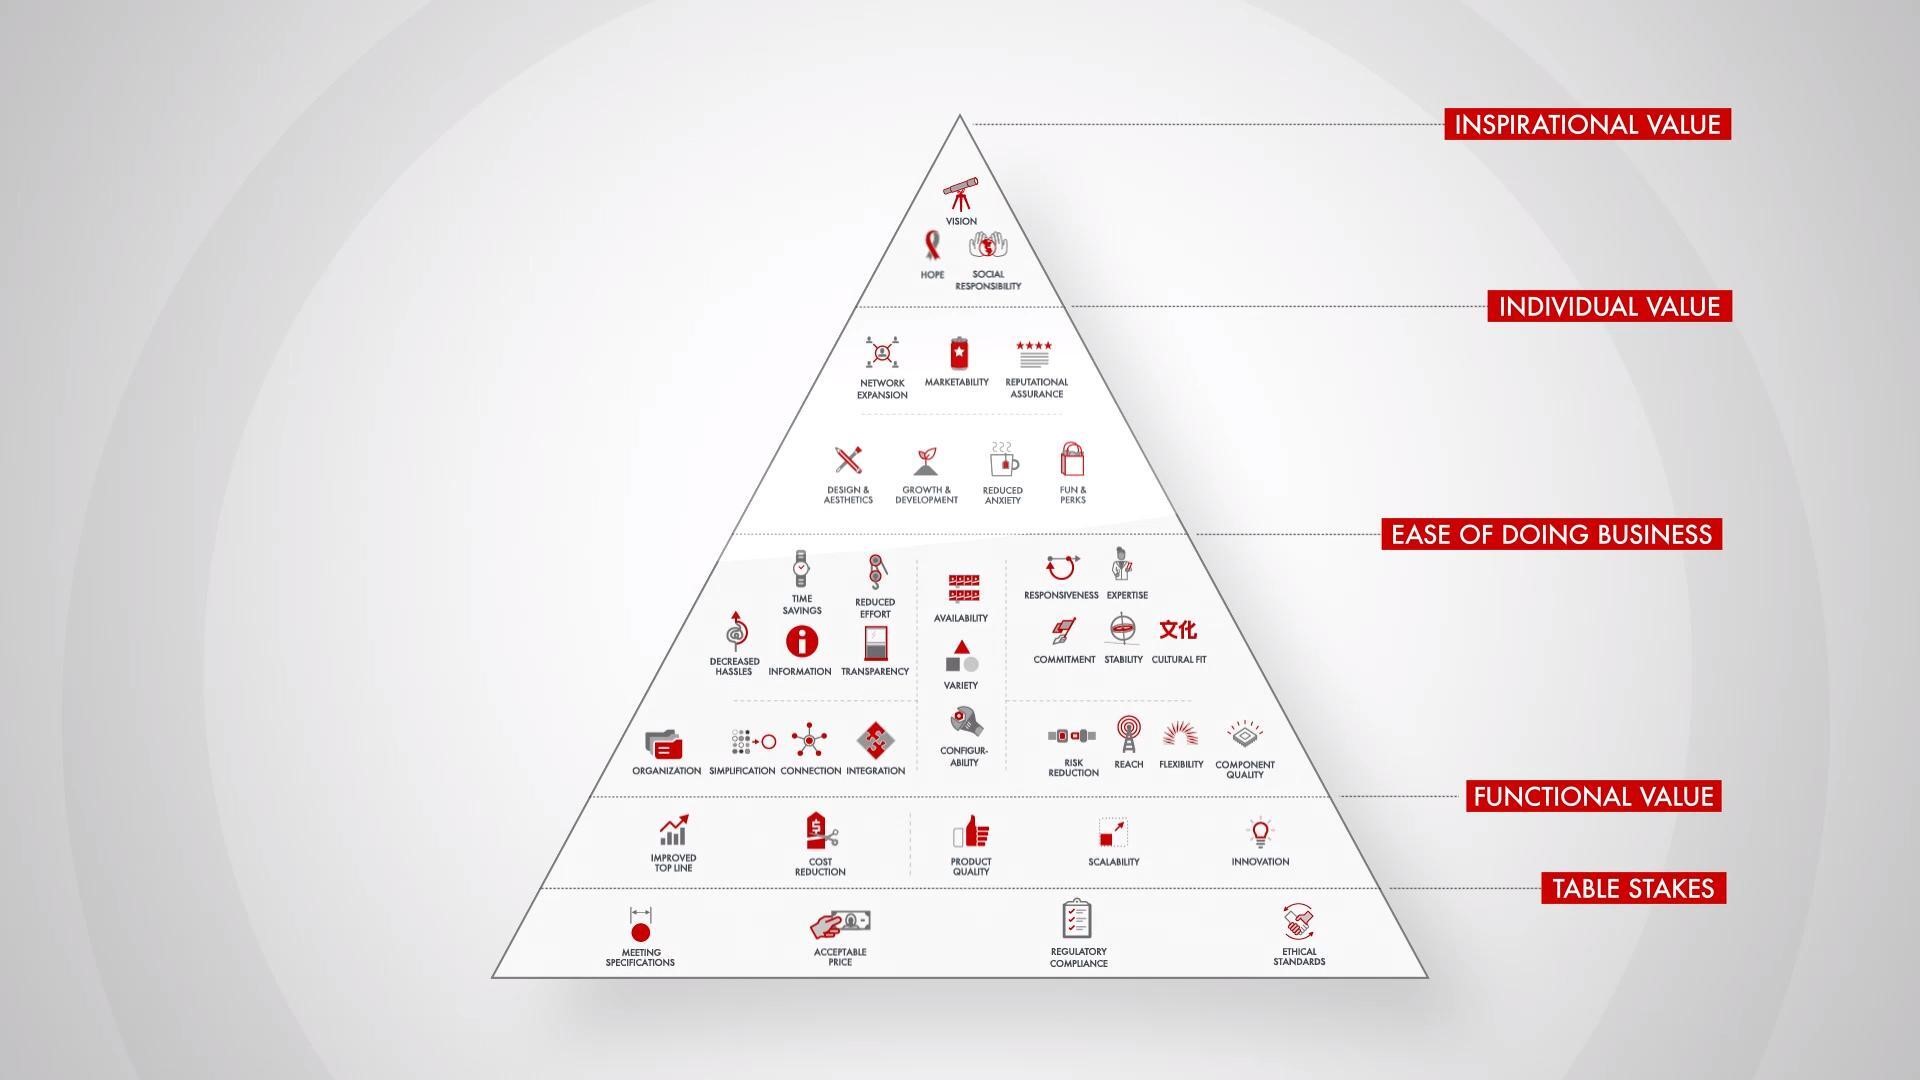
Bain’s Elements of Value Framework
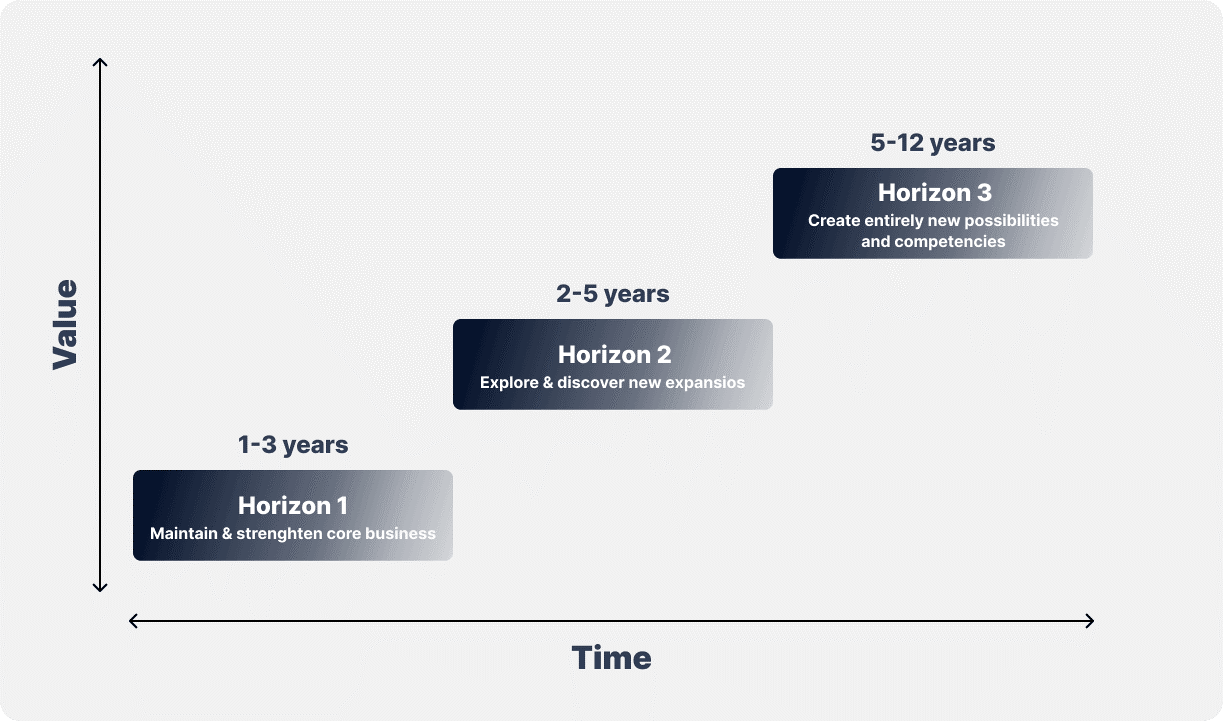
McKinsey Growth Pyramid
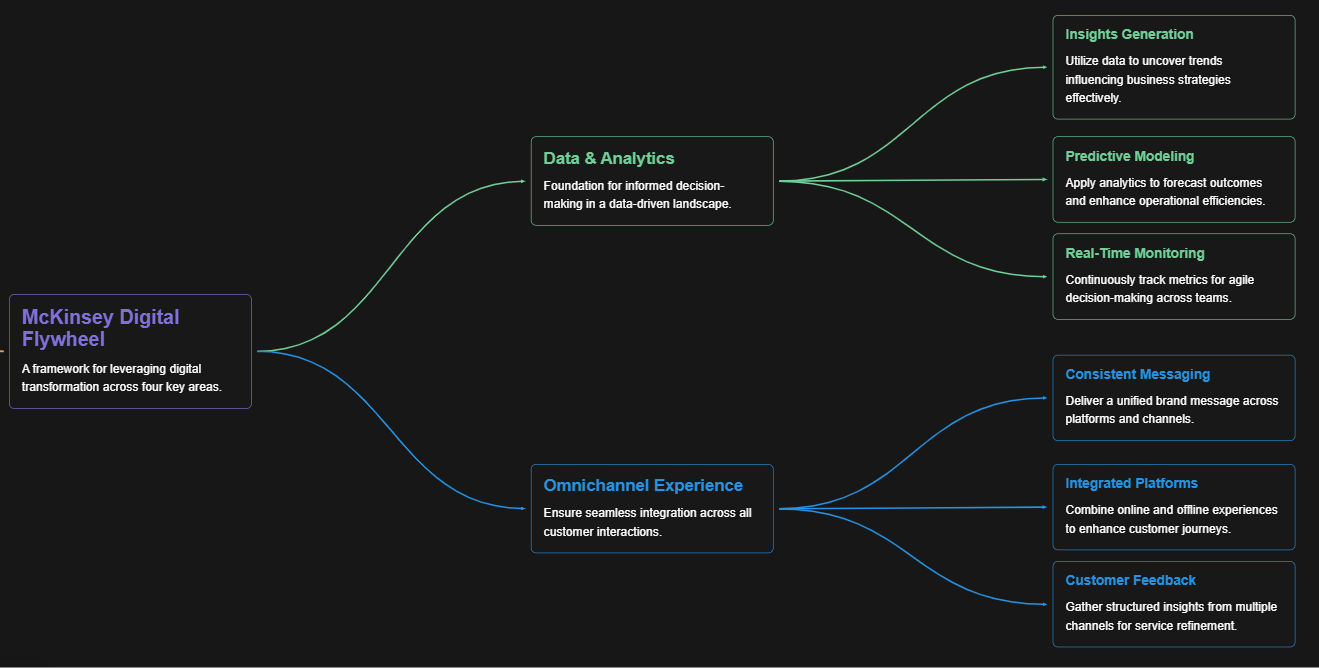
McKinsey Digital Flywheel
McKinsey 9-Box Talent Matrix
McKinsey 7S Framework

The Psychology of Persuasion in Marketing

The Influence of Colors on Branding and Marketing Psychology


