CTR Benchmarks by Format and Industry: Navigating Digital Marketing Performance Standards
Sarah, a seasoned marketing director at a mid-sized fintech company, stared at her campaign dashboard with growing concern. Her display advertising campaigns were delivering a 0.3% click-through rate, and her CEO was questioning the investment. Was this performance acceptable, or were they falling behind industry standards? This scenario plays out in boardrooms worldwide as marketers struggle to contextualize their performance metrics against meaningful benchmarks. Sarah's dilemma reflects a fundamental challenge in digital marketing: understanding what constitutes good performance in an increasingly fragmented advertising landscape.
The quest for performance benchmarks has become more complex as digital advertising formats multiply and consumer behavior evolves across industries. What constitutes success for a luxury travel brand differs dramatically from performance expectations for a fast-moving consumer goods company. This complexity has made industry-specific and format-specific benchmarking not just useful, but essential for strategic decision-making and budget allocation.
Research from the Digital Marketing Institute indicates that companies using industry-specific benchmarks for campaign optimization achieve 34% better return on advertising spend compared to those relying on generic performance metrics. Meanwhile, format-specific benchmarking enables marketers to allocate budgets more effectively, with data showing that informed benchmark usage correlates with 28% higher overall campaign efficiency.
Introduction: The Evolution of Click-Through Rate Benchmarking
Click-through rates have served as a fundamental performance indicator since the early days of digital advertising. However, as the digital ecosystem has evolved from simple banner advertisements to sophisticated programmatic campaigns across multiple formats and platforms, the interpretation of CTR data has become increasingly nuanced.
The modern marketing landscape presents unique challenges for benchmark interpretation. Cross-device user journeys, privacy-first advertising approaches, and platform-specific user behaviors all influence click-through rates in ways that generic benchmarks cannot capture. Furthermore, the rise of artificial intelligence in advertising has created new optimization possibilities that are reshaping what constitutes achievable performance across different formats and industries.
Contemporary benchmark analysis reveals significant variations not just between industries, but within industry segments based on company size, target demographics, and campaign objectives. This complexity necessitates a more sophisticated approach to benchmark utilization that goes beyond simple comparative analysis to strategic performance optimization.
Display Advertising Performance Standards Across Verticals
Display advertising remains the foundation of digital brand awareness campaigns, yet its performance varies dramatically across formats and industries. Current industry data reveals that display campaigns average approximately 0.5% click-through rates, but this figure masks significant variation across sectors and implementation strategies.
Format-Specific Performance Variations
Banner advertising performance differs substantially based on placement, size, and creative approach. Premium placements on high-authority sites consistently outperform programmatic inventory, with performance gaps of 40-60% common across verticals. Rich media formats, including expandable banners and interactive units, typically generate 25-35% higher engagement rates than static alternatives.
Video display advertising represents a distinct performance category, with pre-roll advertisements averaging 1.5% click-through rates across industries. However, this metric varies significantly based on video length, skip options, and targeting precision. Connected TV advertising has emerged as a particularly strong performer, with average CTRs reaching 2.1% in certain verticals.
Industry-Specific Benchmark Analysis
Banking, Financial Services, and Insurance sectors typically achieve display CTRs ranging from 0.3% to 0.7%, with performance heavily influenced by regulatory compliance requirements and conservative creative approaches. However, fintech companies often outperform traditional financial institutions by 30-50% through more aggressive targeting and contemporary creative strategies.
Consumer Packaged Goods companies generally see display performance between 0.4% and 0.8%, with seasonal variations significantly impacting results. Food and beverage brands consistently outperform other CPG categories, particularly during peak consumption periods.
Travel and hospitality represents one of the highest-performing display categories, with CTRs often exceeding 1.0% for well-targeted campaigns. This performance advantage stems from the visual nature of travel marketing and the high-intent nature of travel research behavior.
Search Advertising Benchmarks and Industry Variations
Search advertising continues to deliver the highest click-through rates across digital formats, with average performance ranging from 4% to 6% across industries. This superior performance reflects the high-intent nature of search behavior and the contextual relevance of search advertisements.
Platform-Specific Performance Patterns
Google Ads performance varies significantly between search network and display network placements. Search network campaigns typically achieve CTRs between 3% and 8%, while display network performance aligns more closely with traditional display benchmarks. Bing Ads often deliver higher CTRs than Google in certain verticals, particularly in B2B and professional services categories.
Shopping campaigns represent a distinct performance category within search advertising, with average CTRs ranging from 0.7% to 1.2%. However, high-intent product searches can achieve significantly higher performance, particularly for unique or branded products.
Vertical Performance Analysis
Legal services consistently achieve the highest search CTRs, often exceeding 8% for well-optimized campaigns. This performance stems from the high-value, high-intent nature of legal searches and the limited organic results typically available for legal queries.
Healthcare and medical services achieve search CTRs between 5% and 7%, with performance influenced by local search factors and regulatory restrictions on advertising language. Dental and cosmetic medical services typically outperform general healthcare categories.
Technology and software companies average 4% to 6% search CTRs, with performance varying significantly based on product complexity and target audience sophistication. Enterprise software typically underperforms consumer technology in CTR metrics but often delivers superior conversion rates and customer lifetime value.
Platform-Specific Benchmarking and Optimization Strategies
Different advertising platforms exhibit distinct performance characteristics that require platform-specific benchmarking approaches. Understanding these variations enables more effective budget allocation and campaign optimization strategies.
Social Media Platform Variations
Facebook advertising CTRs average 1.0% to 1.3% across industries, with video content consistently outperforming static images by 25-40%. Instagram campaigns typically achieve 10-15% higher CTRs than Facebook, particularly for visual brands and younger demographics.
LinkedIn represents a unique platform for B2B advertising, with CTRs averaging 0.3% to 0.6%. While these rates appear low compared to other platforms, the professional context and targeting precision often justify the lower engagement rates through superior conversion quality.
Twitter advertising CTRs average 0.5% to 1.0%, with promoted tweets typically outperforming display-style advertisements. Real-time engagement during trending topics or events can significantly boost performance above baseline benchmarks.
Programmatic Advertising Considerations
Programmatic display advertising requires specialized benchmarking due to inventory quality variations and targeting sophistication. Private marketplace deals typically achieve 40-60% higher CTRs than open exchange inventory, justifying premium pricing for quality-conscious advertisers.
Header bidding implementations have improved programmatic performance across all formats, with average CTR improvements of 15-25% compared to traditional waterfall setups. However, these improvements vary significantly based on implementation quality and publisher cooperation.
Case Study: Global Retail Chain Benchmark Optimization
A multinational retail corporation implemented comprehensive benchmark analysis across their digital advertising portfolio, spanning 15 countries and multiple product categories. The company discovered that their display campaigns were underperforming industry benchmarks by 35% in developed markets while exceeding benchmarks by 20% in emerging markets.
Through detailed analysis, they identified that their creative strategy, optimized for emerging market preferences, was not resonating with developed market audiences. By implementing region-specific creative strategies and adjusting targeting parameters based on local industry benchmarks, they achieved a 42% improvement in overall campaign performance within six months.
The company also discovered significant variations in search advertising performance across product categories. Electronics and home goods exceeded industry benchmarks consistently, while apparel and accessories underperformed. This insight led to budget reallocation that improved overall ROAS by 28% while maintaining total advertising spend.
Conclusion: Strategic Benchmark Implementation for Competitive Advantage
Effective benchmark utilization extends beyond simple performance comparison to strategic advantage creation. Organizations that implement sophisticated benchmarking frameworks, incorporating industry-specific, format-specific, and platform-specific standards, consistently outperform competitors using generic performance metrics.
The future of benchmark analysis lies in dynamic, AI-driven approaches that account for seasonal variations, competitive landscape changes, and evolving consumer behaviors. Machine learning algorithms are increasingly capable of predicting benchmark shifts and recommending proactive optimization strategies.
As privacy regulations reshape the digital advertising landscape, benchmark interpretation must evolve to account for reduced targeting precision and measurement capabilities. Organizations that adapt their benchmarking frameworks to these changes will maintain competitive advantages as the industry transitions to privacy-first advertising approaches.
Call to Action
Marketing leaders should implement comprehensive benchmarking frameworks that incorporate multiple performance dimensions and competitive intelligence. Establish quarterly benchmark reviews that account for seasonal variations and competitive landscape changes. Invest in advanced analytics capabilities that enable real-time benchmark comparison and optimization recommendations. Most importantly, use benchmark insights to inform strategic budget allocation decisions rather than simply evaluating past performance.
Featured Blogs
BCG Digital Acceleration Index
Bain’s Elements of Value Framework
McKinsey Growth Pyramid
McKinsey Digital Flywheel
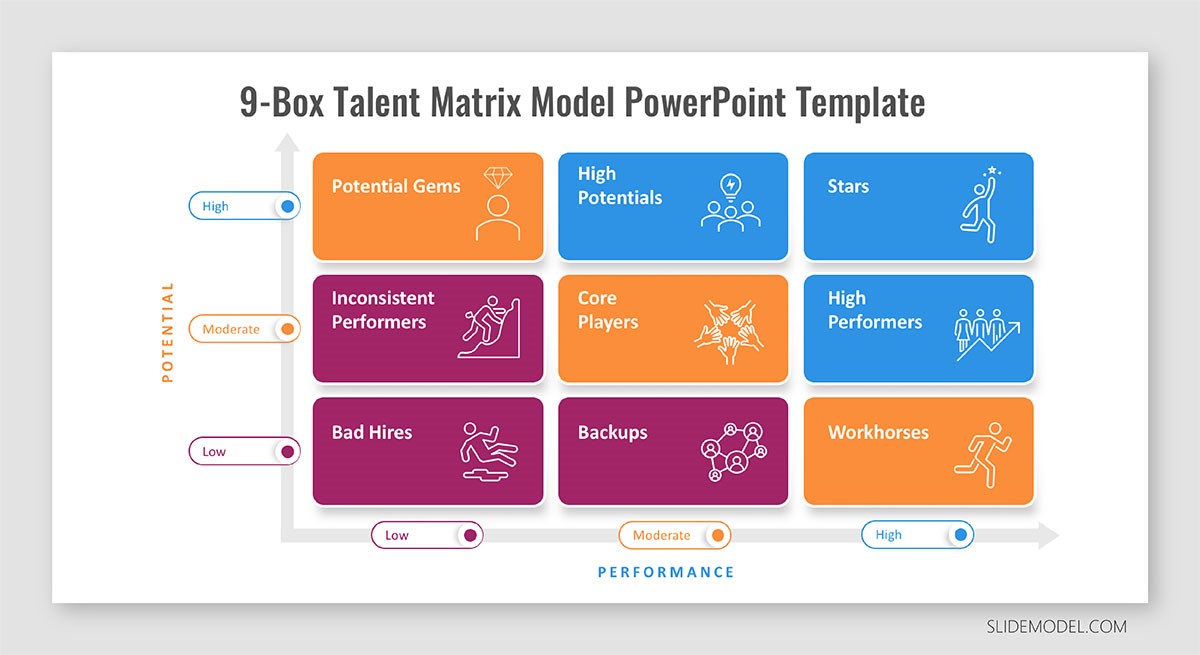
McKinsey 9-Box Talent Matrix
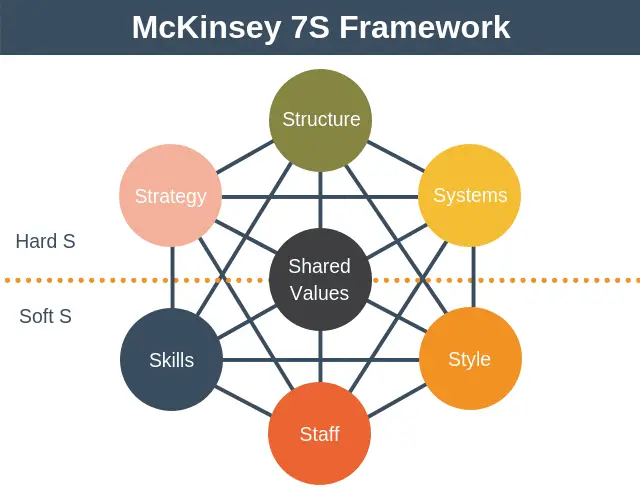
McKinsey 7S Framework

The Psychology of Persuasion in Marketing

The Influence of Colors on Branding and Marketing Psychology


