Media Planning Dashboards for Real-Time Decisions: The Command Center Approach
Alexandra Rodriguez, VP of Media Operations at a multinational technology company, was managing a complex product launch campaign across 12 markets when she realized her team was spending more time collecting data than making strategic decisions. Each morning began with hours of manual report compilation from various platforms, leaving little time for actual optimization and strategic thinking. Campaign performance discussions were based on data that was already 24-48 hours old, making real-time adjustments nearly impossible. The breakthrough came when her team implemented a unified dashboard system that aggregated all campaign metrics into a single, real-time view. Within the first week, her team identified and corrected a significant budget allocation issue that would have cost them $2.3 million in wasted spend, while simultaneously discovering an unexpected audience segment that became their highest-performing group. This transformation led Alexandra to champion what she calls "mission control marketing" – where real-time data visibility enables rapid, informed decision-making that dramatically improves campaign performance.
Introduction: The Evolution of Media Intelligence
Media planning dashboards represent the evolution from reactive reporting to proactive strategic management, providing real-time visibility into campaign performance across all channels and enabling immediate optimization based on comprehensive data integration. These systems transform media teams from data collectors into strategic decision-makers by automating information gathering and presenting actionable insights through intuitive interfaces.
The complexity of modern media landscapes, which span multiple platforms, audience segments, geographic markets, and attribution models, creates an overwhelming data management challenge that traditional reporting approaches cannot effectively address. Research from the Marketing Operations Research Institute indicates that media teams using integrated dashboard systems make 73% faster optimization decisions and achieve 41% better campaign performance compared to teams relying on manual reporting processes.
Marketing technology analyst David Raab emphasizes that dashboard effectiveness depends not on data volume but on insight accessibility, arguing that the best systems surface critical information automatically while enabling deep-dive analysis when needed. The most successful dashboard implementations balance comprehensive data coverage with focused metric presentation, ensuring strategic clarity rather than information overload.
1. Visualize GRPs Spends Reach Frequency in One View
Unified metric visualization provides comprehensive campaign performance visibility through integrated displays that combine traditional media metrics with digital performance indicators, enabling holistic media strategy evaluation and optimization.
Integrated Metric Frameworks
Modern media dashboards integrate traditional advertising metrics like Gross Rating Points and reach with digital performance indicators including click-through rates, conversion metrics, and attribution data. This integration enables comprehensive media mix evaluation that considers both awareness building and performance objectives within unified analytical frameworks.
Real-Time Performance Monitoring
Advanced dashboard systems provide real-time performance monitoring that updates key metrics continuously, enabling immediate identification of performance changes and optimization opportunities. This includes live budget tracking that shows actual versus planned spend allocation, audience delivery monitoring that tracks reach and frequency against targets, and performance alert systems that notify teams of significant metric changes.
Cross-Channel Attribution Visualization
Sophisticated dashboards incorporate cross-channel attribution visualization that shows how different media channels contribute to overall campaign objectives. This includes customer journey mapping that visualizes touchpoint sequences and conversion paths, incremental impact analysis that measures each channel's unique contribution, and optimization recommendation engines that suggest budget reallocation opportunities based on attribution data.
2. Enables Agility in Campaign Management
Dashboard-enabled agility transforms campaign management from scheduled optimization cycles to continuous adaptive management based on real-time performance data and market condition changes.
Dynamic Budget Optimization
Real-time dashboard visibility enables dynamic budget optimization that shifts spending based on performance patterns and opportunity identification. This includes automated budget reallocation triggers that move spending from underperforming to high-performing channels, opportunity capture systems that increase investment in unexpectedly successful audience segments, and protective spending controls that prevent budget waste during performance anomalies.
Rapid Response Capabilities
Dashboard-enabled teams can respond rapidly to market changes, competitive actions, and performance fluctuations through immediate visibility into campaign impact. This includes crisis response protocols that enable quick campaign adjustments during negative events, competitive response systems that adapt strategies based on market intelligence, and seasonal optimization capabilities that adjust campaigns based on performance pattern recognition.
Predictive Optimization Triggers
Advanced dashboards incorporate predictive analytics that identify optimization opportunities before performance degradation occurs. This includes audience fatigue prediction that suggests creative rotation timing, budget pacing optimization that prevents early period overspend or underspend, and channel saturation identification that recommends diversification before diminishing returns impact performance.
3. Platforms Google Data Studio Tableau Power BI
Platform selection significantly impacts dashboard effectiveness, with different solutions offering distinct advantages for specific organizational needs, technical requirements, and analytical sophistication levels.
Google Data Studio Applications
Google Data Studio provides accessible dashboard creation with strong integration to Google marketing platforms and cost-effective implementation for smaller organizations. Strengths include seamless Google Ads and Analytics integration, collaborative sharing and editing capabilities, and automated report generation and distribution. However, limitations include restricted customization options for complex analytical requirements and performance constraints with large datasets.
Tableau Enterprise Solutions
Tableau offers sophisticated analytical capabilities and flexible visualization options suitable for complex media operations requiring advanced statistical analysis and custom metric development. Advantages include powerful data modeling and transformation capabilities, advanced statistical analysis and forecasting features, and extensive customization options for specialized requirements. Considerations include higher implementation costs and technical complexity requiring specialized expertise.
Microsoft Power BI Integration
Power BI provides strong integration with Microsoft business systems and balanced functionality between accessibility and analytical sophistication. Benefits include seamless integration with Office 365 and Azure ecosystems, cost-effective licensing for organizations with existing Microsoft investments, and robust data governance and security features suitable for enterprise environments.
Case Study: Unilever's Global Media Command Center
Unilever's implementation of a global media dashboard system demonstrates enterprise-scale integration that manages campaigns across 190 countries and hundreds of brands through unified visibility and control systems.
Their dashboard architecture integrates data from over 50 advertising platforms, traditional media measurement systems, and retail performance data to provide comprehensive campaign visibility. Real-time performance monitoring tracks campaign delivery across all markets simultaneously, with automated alert systems that notify regional teams of significant performance changes within 15 minutes.
The system enables dynamic budget optimization across markets based on performance patterns, with automated reallocation rules that shift spending from underperforming regions to high-opportunity markets. Cross-market learning systems identify successful tactics in one region and recommend testing in similar markets automatically.
Regional customization capabilities allow local teams to adapt global dashboard templates for local platform preferences and measurement requirements while maintaining consistent reporting standards. Advanced attribution modeling provides unified measurement across traditional and digital channels, enabling accurate media mix optimization at both global and local levels.
Implementation results demonstrate substantial operational improvement: 67% reduction in reporting preparation time, enabling teams to focus on strategic optimization rather than data compilation. 43% improvement in campaign performance through faster identification and resolution of issues. 52% increase in cross-market campaign coordination through shared visibility and standardized metrics.
Most significantly, their unified dashboard approach enabled Unilever to achieve 31% improvement in media efficiency across all markets while maintaining consistent brand messaging and strategic alignment, demonstrating how systematic dashboard implementation can scale operational excellence across complex global organizations.
Conclusion: The Future of Media Intelligence
Media dashboard technology continues evolving toward greater automation, predictive capabilities, and artificial intelligence integration. Emerging trends include AI-powered insight generation that automatically identifies optimization opportunities and strategic recommendations, voice-activated dashboard interaction that enables hands-free performance monitoring, and augmented reality visualization that provides immersive campaign performance analysis.
The most successful dashboard implementations treat real-time visibility as a competitive advantage rather than operational convenience, using immediate access to performance data to capture optimization opportunities that competitors miss through delayed reporting cycles. As campaign complexity increases and market conditions change more rapidly, real-time dashboard capabilities become increasingly critical for maintaining competitive performance.
Call to Action
For media leaders considering dashboard implementation, begin with comprehensive requirement assessment that identifies key metrics, user needs, and integration requirements across all campaign management workflows. Prioritize platforms that offer strong integration capabilities with existing marketing technology stack while providing growth flexibility for future needs. Establish clear governance frameworks that ensure data accuracy and consistent metric definitions across all dashboard users. Most importantly, focus on actionable insight generation rather than comprehensive data display, ensuring dashboard systems enhance decision-making speed and quality rather than simply automating existing reporting processes.
Featured Blogs
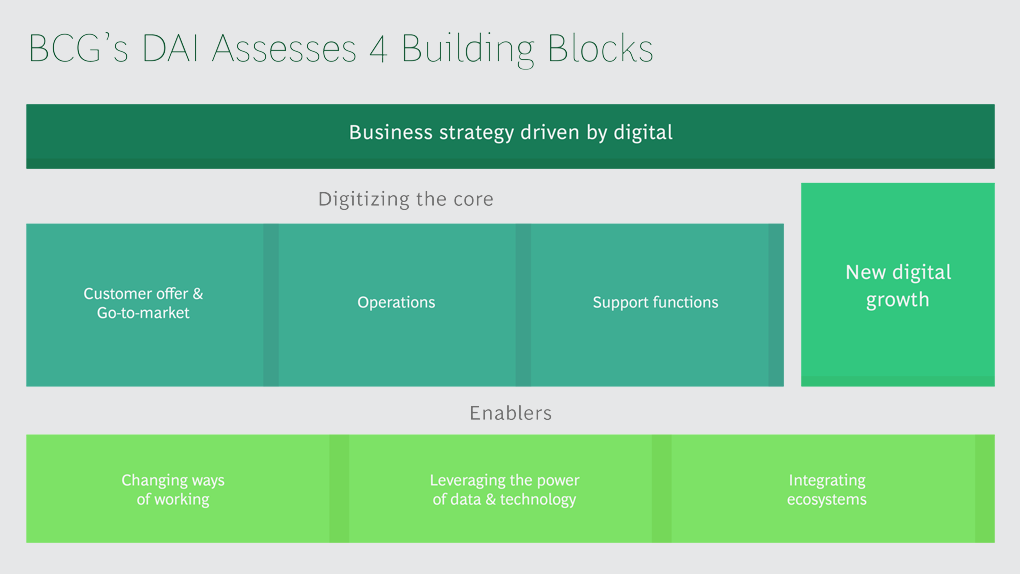
BCG Digital Acceleration Index
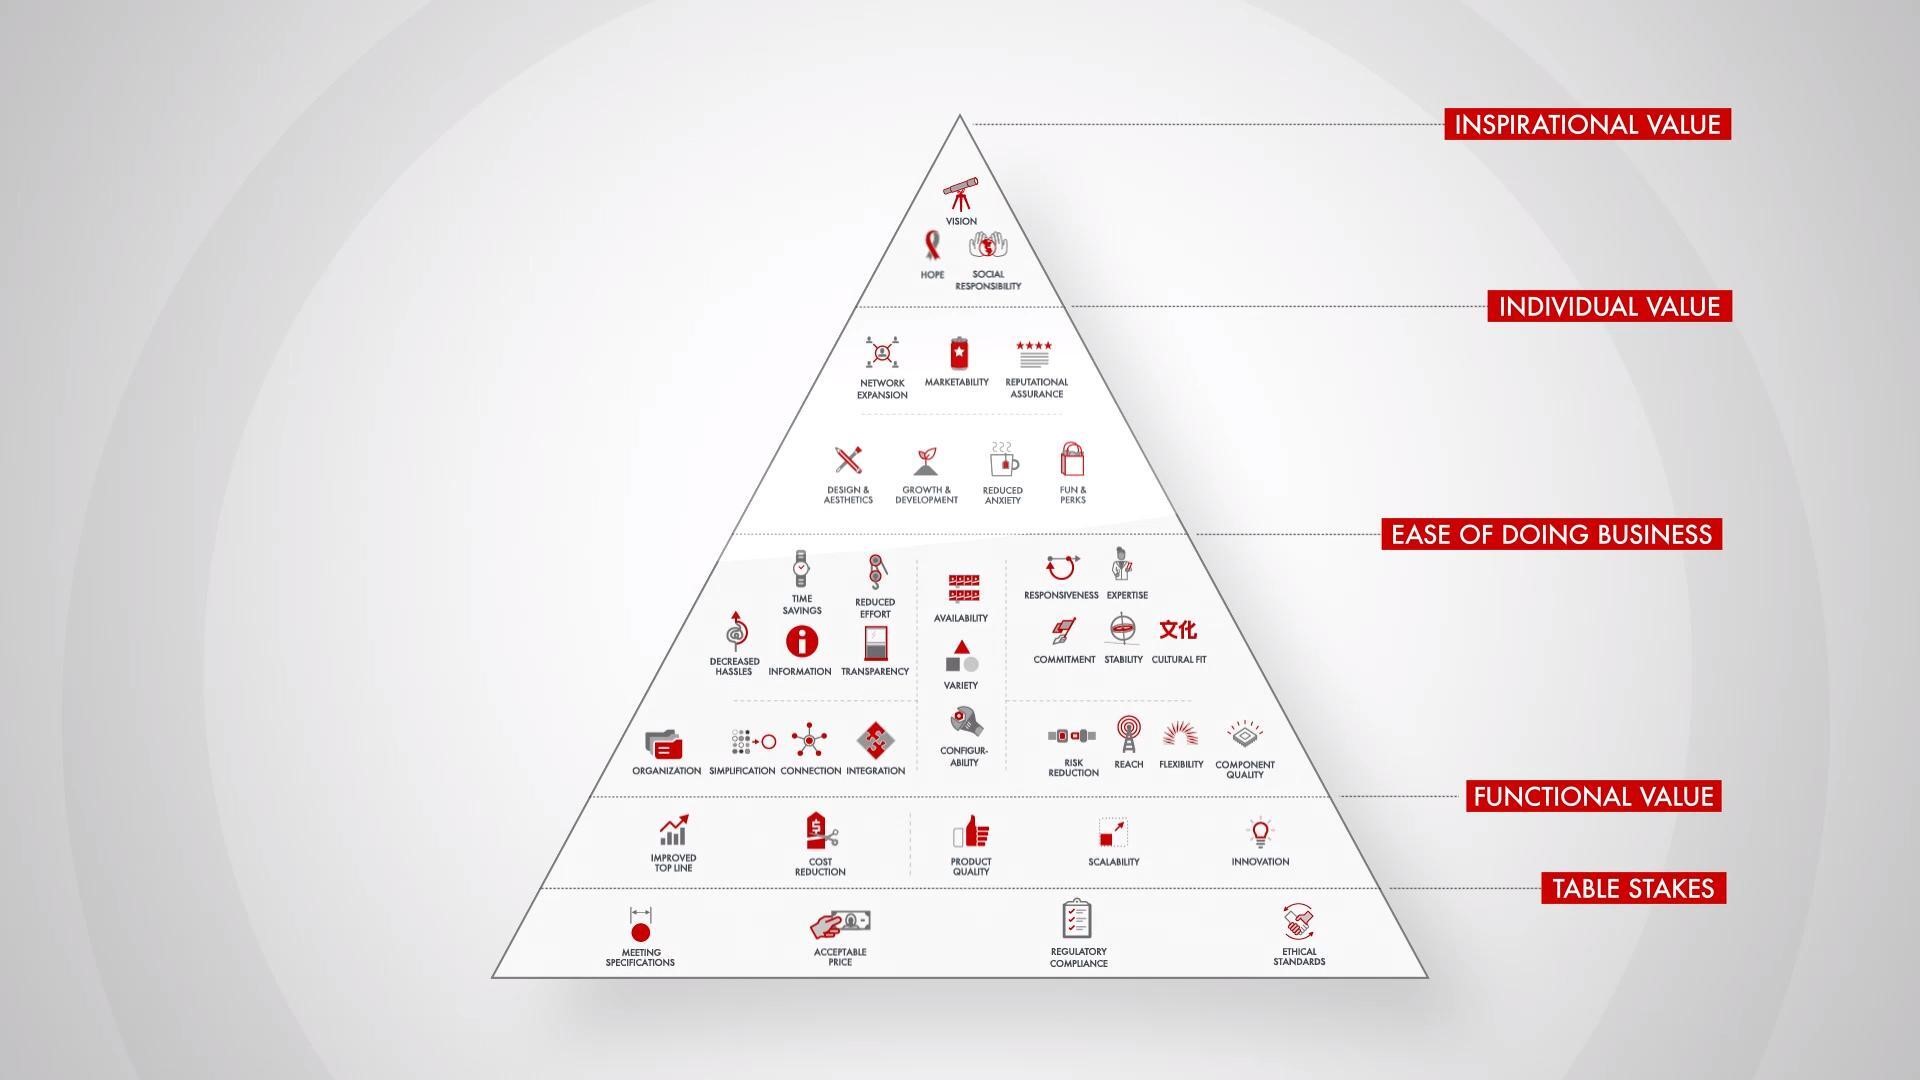
Bain’s Elements of Value Framework
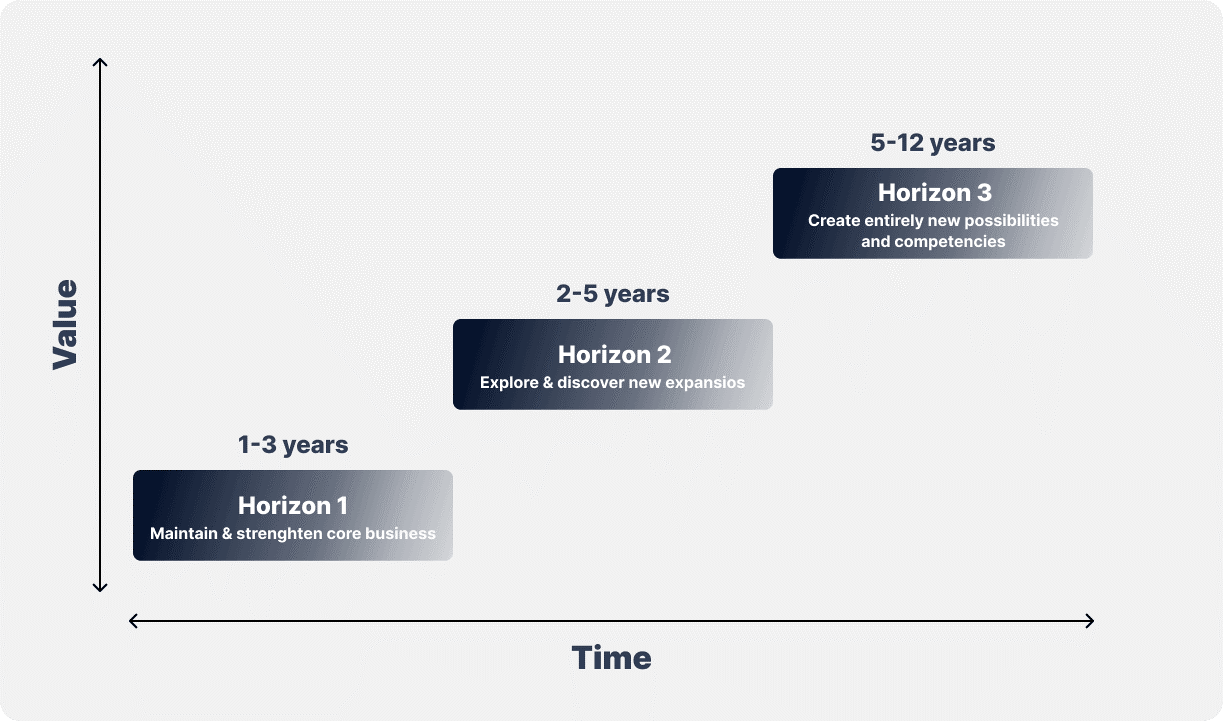
McKinsey Growth Pyramid
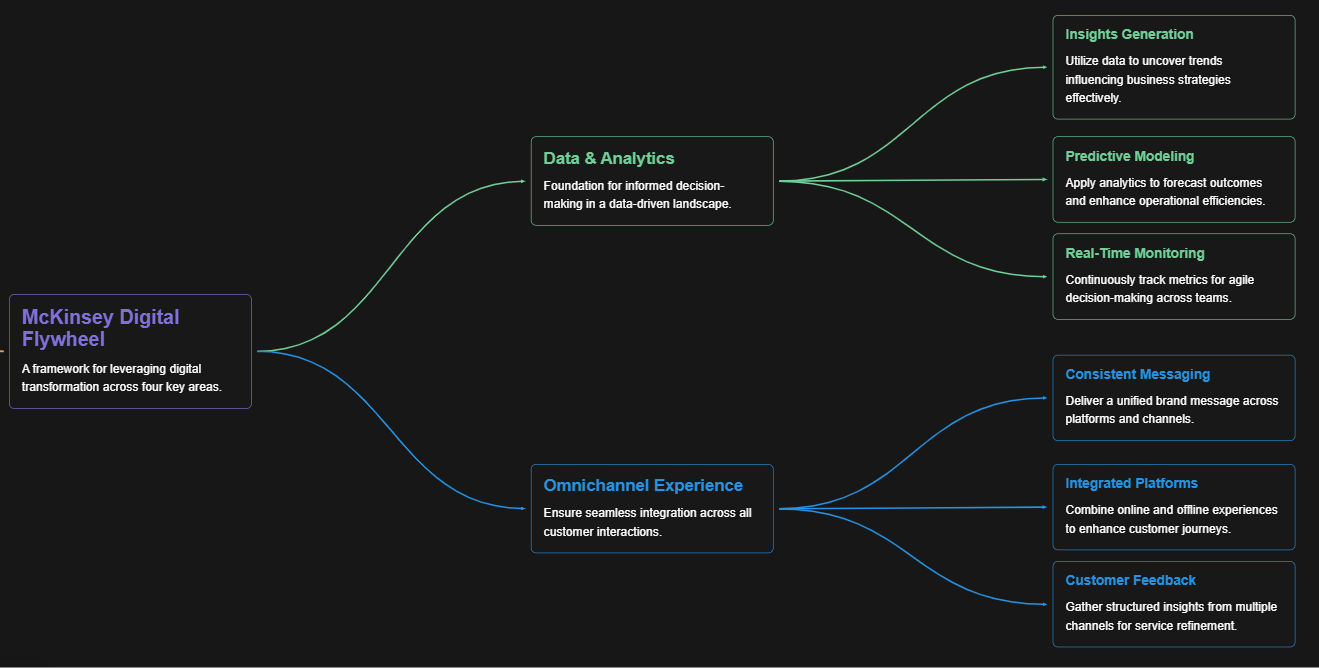
McKinsey Digital Flywheel
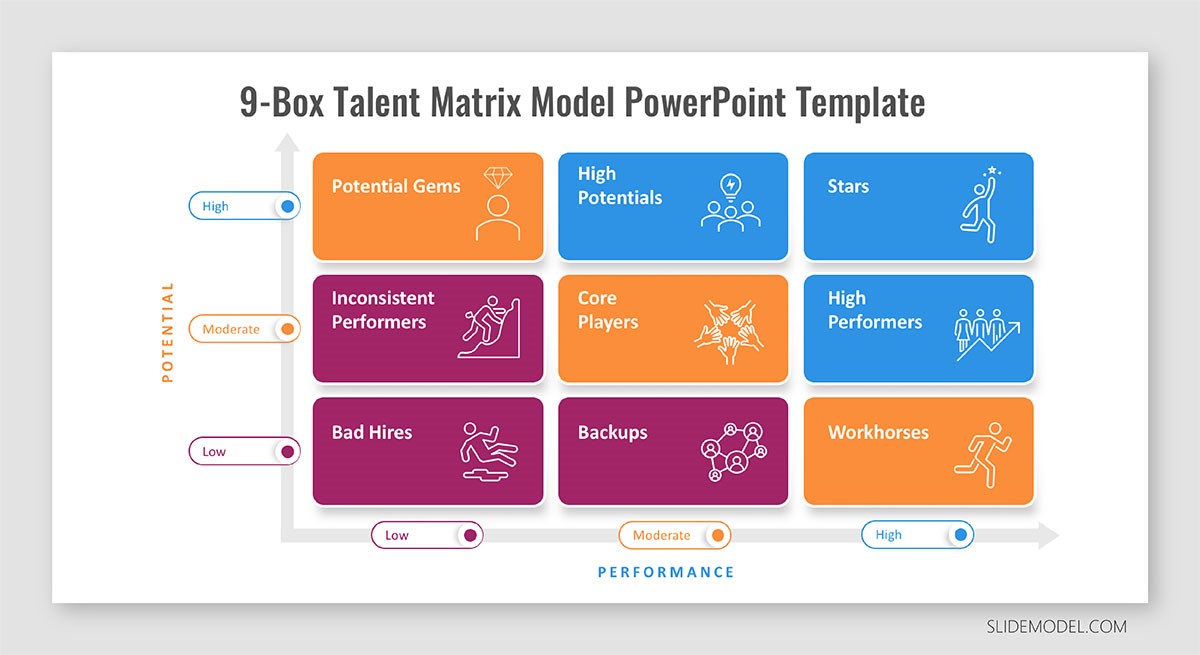
McKinsey 9-Box Talent Matrix
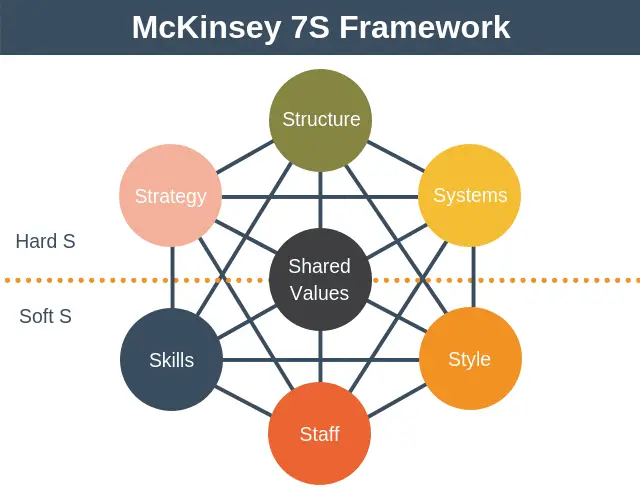
McKinsey 7S Framework
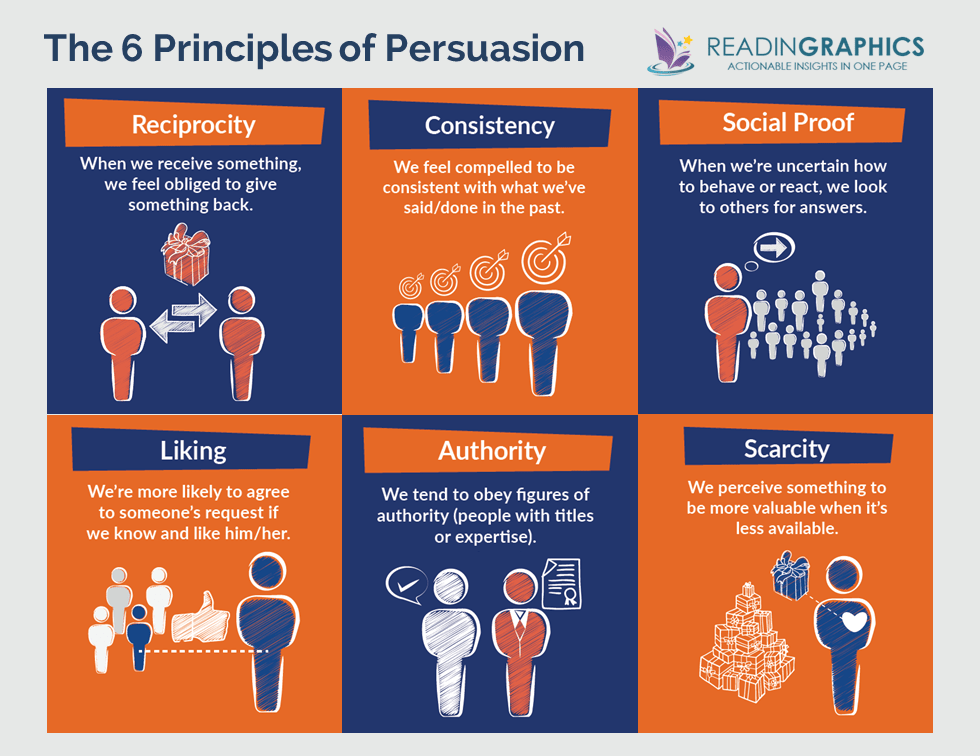
The Psychology of Persuasion in Marketing
The Influence of Colors on Branding and Marketing Psychology


