The Big Mac Illusion: What a Burger Tells Us About Global Economics
Walk into a McDonald's anywhere in the world, and you’ll see the same burger on the menu—the Big Mac. A sesame seed bun, lettuce, pickles, cheese, sauce, and a double patty. Standardized. Predictable. Comfortingly familiar.
But beneath that golden bun lies something unexpected: a powerful mirror into the global economy.
Welcome to the Big Mac Index, an elegantly simple concept first cooked up by The Economist in 1986. Now in its 39th year, the index remains a clever tool for making sense of a complicated truth—how much is your currency really worth?
One Burger, 55 Economies
The January 2025 edition is a fascinating snapshot of global pricing disparities. Consider this:
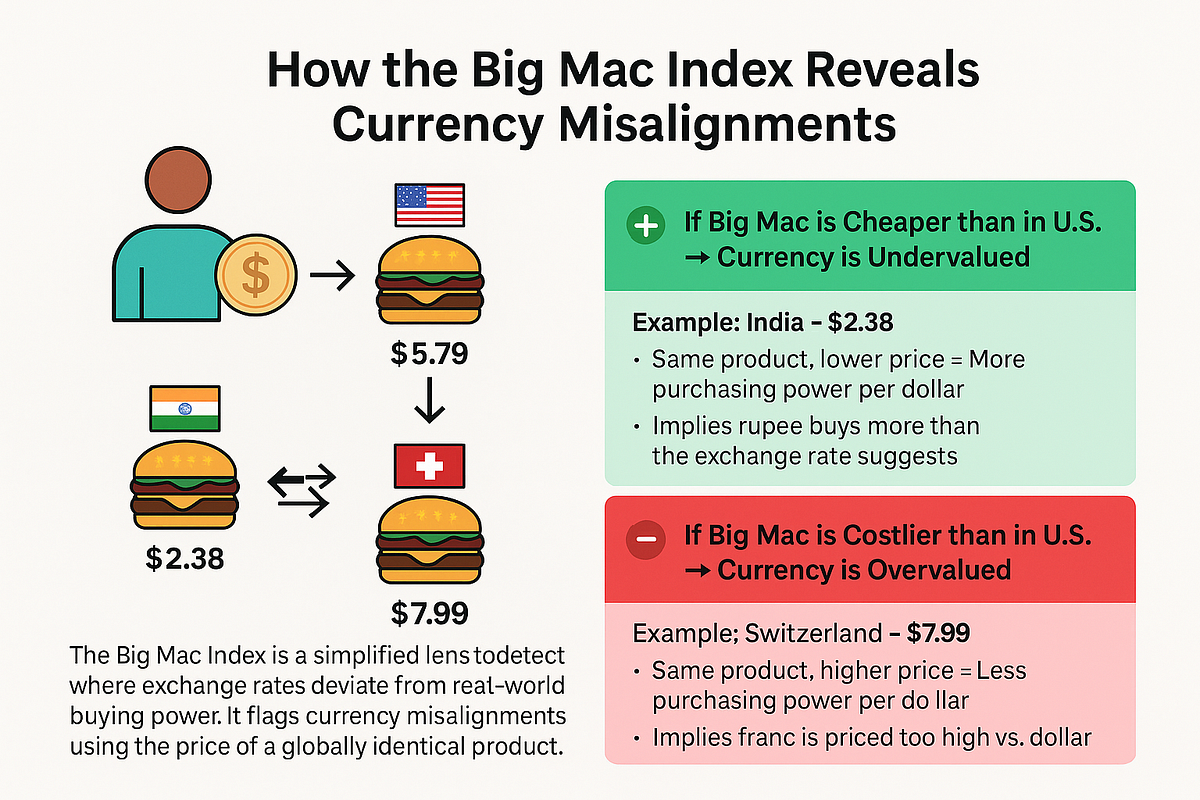
- In Switzerland, a Big Mac costs $7.99, making it the most expensive in the world.
- In the U.S., it’s $5.79—the benchmark for the index.
- In India, it’s a mere $2.38.
That’s a 3.4x price differential for the exact same burger. Why?
The answer, and the point of the index, lies in the notion of Purchasing Power Parity (PPP). If the world were truly economically efficient—and frictionless—a Big Mac should cost the same everywhere after converting currencies. It doesn’t. And the reasons why expose the complex forces shaping global value.
What’s Really Being Measured?
Economists will tell you the Big Mac Index isn’t perfect—and it’s not meant to be. But it’s revealing in ways that more complex models sometimes are not.
- It shows how far your money goes.
A dollar buys you more beef in Jakarta than in Geneva. - It exposes currency misalignments.
If the burger is cheaper than the U.S. price after conversion, the local currency may be undervalued. Pricier? Likely overvalued. - It highlights structural inefficiencies.
Labor costs, import taxes, real estate prices, and market competition all shape that final price.
Now Unpacking each of the points 1,2,3 –
1. “It shows how far your money goes” — What Does That Really Mean?
This is all about purchasing power: how much stuff (in this case, a Big Mac) you can buy with one U.S. dollar in different parts of the world.
Let’s take an example:
- In the U.S., a Big Mac costs $5.79.
- In Jakarta (Indonesia), it costs around $2.54 (based on the 2025 index).
- In Geneva (Switzerland), it costs $7.99.
So, if you walk into a McDonald’s with $1:
- In Indonesia, you can afford almost half a Big Mac.
- In Switzerland, you can only afford about one-eighth of one.
What Does This Tell Us?
It tells us that a dollar stretches much further in Indonesia than in Switzerland.
In other words, the same amount of money buys you more in some countries and less in others.
Why This Matters
This idea — that $1 has different real-world value depending on where you are — is at the heart of Purchasing Power Parity (PPP).
The Big Mac Index brings this to life in a very relatable way.
Instead of abstract statistics, it answers a simple human question:
“How much can I eat for a dollar in this country?”
2. Currency Misalignments via the Big Mac Index: What Does It Mean?
Imagine the Big Mac in the U.S. costs $5.79. Now suppose in India, it costs the equivalent of $2.38 when converted into U.S. dollars at the current exchange rate.
So, same burger, same brand, but wildly different prices in dollar terms.
This difference suggests something important:
- If the Big Mac is cheaper than in the U.S., it implies that the local currency is undervalued—you’re getting more bang for your buck in that country.
- Example: If $1 buys more goods in India than in the U.S., it signals the rupee is undervalued compared to the dollar.
- If the Big Mac is more expensive than in the U.S., it implies the local currency is overvalued—your dollar doesn’t stretch as far.
- Example: In Switzerland, the Big Mac costs $7.99. That’s $2.20 more than in the U.S., suggesting the Swiss franc is overvalued against the dollar.
3. What Do We Mean by "Structural Inefficiencies"?
The Big Mac Index doesn’t just reflect currency value — it also surfaces the hidden structural costs baked into each economy.
Even if two countries had the same exchange rate and similar purchasing power, a Big Mac might still cost more in one country. Why?
Because structural inefficiencies—the economic plumbing behind the scenes—can push prices up or down.
Let’s break that down:
1. Labor Costs
- In countries like Switzerland or Norway, wages are high — even for entry-level service jobs.
- McDonald's has to pay more for staff, which inflates burger prices.
Effect: Higher Big Mac price, even if the currency is fairly valued.
2. Import Taxes & Supply Chains
- Ingredients might be imported in some regions (e.g., lettuce, cheese, beef).
- In countries with high tariffs, inefficient logistics, or supply chain delays, that burger costs more to make.
Effect: A $2 burger becomes $5 due to inefficiencies in getting the product on the plate.
3. Real Estate Prices
- Urban McDonald's locations often sit in high-rent districts.
- In places like Tokyo, London, or Zurich, sky-high real estate prices get passed onto the consumer.
Effect: Same burger, but more expensive real estate = higher cost per unit sold.
4. Market Competition
- In hyper-competitive markets (like the U.S. or India), McDonald’s keeps prices low to fend off local rivals.
- In monopolistic or less competitive markets, they may charge more — because they can.
Effect: Same burger, but pricing strategy changes due to the local market dynamics.
So, What’s the Big Deal?
It shows us that price ≠ just currency.
The cost of a Big Mac reflects a country’s efficiency at turning raw materials, labor, and logistics into consumer products. That’s a powerful, real-world way of measuring economic friction.
And Why Does This Matter for PPP?
Purchasing Power Parity (PPP) says that a dollar should buy the same “basket of goods” everywhere.
But the Big Mac Index shows that real-life PPP isn’t just about exchange rates. It's shaped by deep economic structures — many of which are invisible in traditional PPP models.
Why Is This Insightful?
Because the Big Mac is a globally standardized product, it acts as a rough "anchor" for measuring Purchasing Power Parity (PPP)—how much actual stuff one unit of currency can buy.
If exchange rates were perfectly fair and efficient, the dollar-converted price of a Big Mac should be the same everywhere. But in reality, it's not. These differences reveal currency misalignments caused by:
- Government intervention
- Market inefficiencies
- Inflation differences
- Wage structures and input costs
So, the Big Mac Index flags where currencies are not priced "fairly" relative to their real-world purchasing power.
An Interesting observation was the difference in the Big Mac Price in Norway ($ 6.67) and Denmark ($ 5.49) – 2 countries in Western Europe close to each other
Why is Norway more expensive than Denmark?
1. Norway is not in the EU
Unlike Denmark, Norway is not part of the European Union — it’s part of the EEA (European Economic Area). This means:
- Higher import costs due to lack of tariff-free access to the EU common market.
- Custom duties and trade policies on food ingredients may differ, pushing up operational costs.
2. Higher Labor Costs in Norway
Norway has some of the highest average wages in the world, especially in the service industry. Even though both countries have strong welfare models, Norwegian wages are typically higher than Denmark’s in the same job roles.
3. Stronger Currency – The Norwegian Krone
The exchange rate plays a big role. If the Norwegian krone is stronger relative to the U.S. dollar than the Danish krone is, then even a similar local price in kroner would translate to a higher dollar price.
4. Higher Food and Retail Taxes
Norway has a 25% VAT on restaurant food (like Denmark), but also adds excise duties on some agricultural and imported goods. Combined with fewer local suppliers and reliance on imports, this drives up costs.
Big Macs, Big Gaps: What the 2025 Rankings Reveal
Let’s unpack some 2025 standouts:
- Argentina ($6.95) has a sky-high Big Mac price despite a turbulent economy—indicative of local inflation and import costs rather than true purchasing power.
- India ($2.38) remains among the cheapest, reflecting both low wages and locally sourced ingredients.
- Euro Area ($5.95) shows how the Euro sits slightly above parity with the U.S. dollar on consumer costs.
- Turkey ($5.36) appears close to parity, but that masks recent inflation and currency volatility.
What emerges is not just a list of burger prices—but a proxy for the real lived cost of consumption in each nation.
A Strategic Lens on the Index
We’re trained to separate signal from noise. So how should decision-makers read the Big Mac Index?
1. A Consumer Lens:
Multinational pricing strategies need to account for local purchasing power—not just exchange rates. Global brands must adapt product portfolios and pricing to local realities, not dollar-denominated spreadsheets.
2. A Currency Signal:
While not a trading tool, the index flags long-term misalignments. In the 2000s, it famously predicted the undervaluation of China’s yuan—well before global policy caught up.
3. A Localization Reminder:
A Big Mac may be global, but pricing is deeply local. That truth extends to labor, supply chains, and regulation—essential factors for any market entry strategy.
Why the Index Endures
The Big Mac Index persists not because it’s perfect, but because it’s provocative. It turns abstract economic theory into something anyone can chew on. It reminds us that value is relative, and that local context matters, even in an era of globalization.
In a world increasingly shaped by volatility—currency wars, inflation surges, and geopolitical shockwaves—this humble burger keeps asking the right question:
What is your money really worth?
Final Thought
The Big Mac Index isn’t about burgers. It’s about understanding the friction between nominal prices and real value. It’s a lesson every strategist, economist, and global brand leader should remember:
Even in a flat world, not everything costs the same.
Because value—like taste—is deeply local.
Featured Blogs
TRENDS 2024: Decoding India’s Zeitgeist: Key Themes, Implications & Future Outlook
How to better quantify attention in TV and Print in India

AI in media agencies: Transforming data into actionable insights for strategic growth

How the Attention Recession Is Changing Marketing
The New Luxury Why Consumers Now Value Scarcity Over Status

The Psychology Behind Buy Now Pay later

The Rise of Dark Social and Its Impact on Marketing Measurement

The Role of Dark Patterns in Digital Marketing and Ethical Concerns

The Future of Retail Media Networks and What Marketers Should Know
Recent Blogs

Operating in the Age of Agents (The New Operating Model)
Ad Stock & Decay: The Invisible Hand Guiding Media Schedules

The Big Mac Illusion:What a Burger Tells Us About Global Economics

When Search Starts Thinking How AI Is Rewriting the Discovery Journey

CEP Tracker The Modern Brand Health Metric
