Ad Stock & Decay: The Invisible Hand Guiding Media Schedules
Why This Matters
Media planning often obsesses over bursts, flights, and GRPs. But behind the scenes, a hidden factor drives whether your spend is working hard or fading away: ad stock.
Ad stock is simply the residual memory of advertising — the carryover effect that remains in the consumer’s head after the ad stops running. Think of it like body heat after a workout: the activity is over, but the warmth lingers.
1.The Build-Up: How Ad Stock Stores Media Impact
Press enter or click to view image in full size
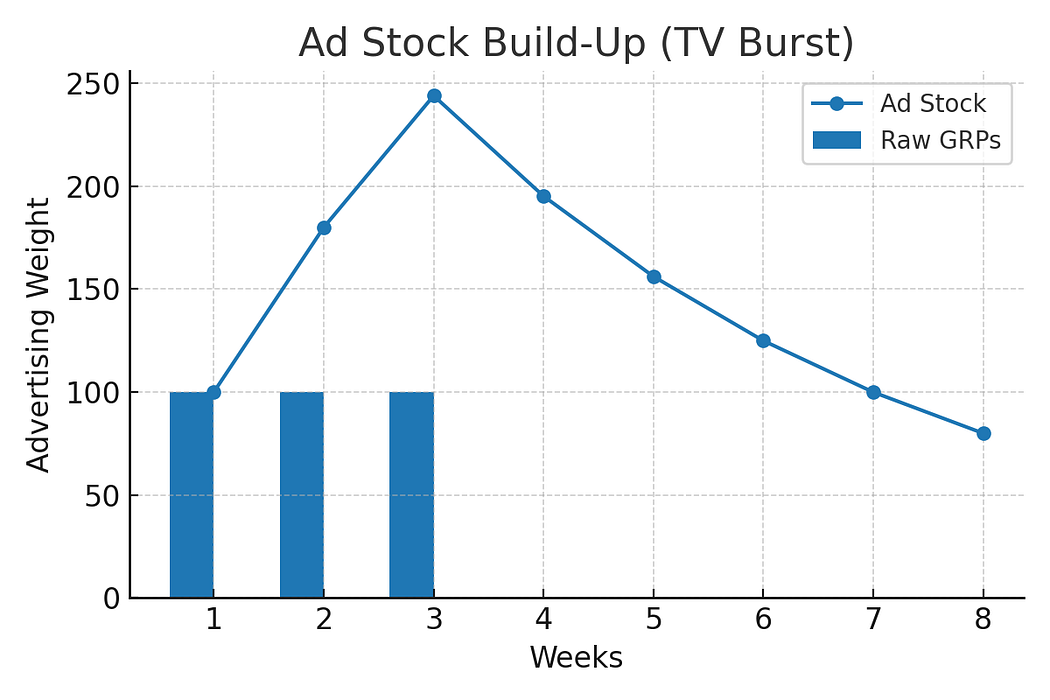
When you run ads, each exposure doesn’t just vanish. It adds to a “stock” of awareness.
- TV & Print: Memory lingers, so bursts accumulate.
- Digital Video & Reels: Effects fade quickly, so stock builds shallow but fast.
Smart planners use this to sequence bursts: strike when memory is high, pause when stock is still “carrying” the weight.
2. The Decay Curve: How Quickly the Effect Fades
Press enter or click to view image in full size
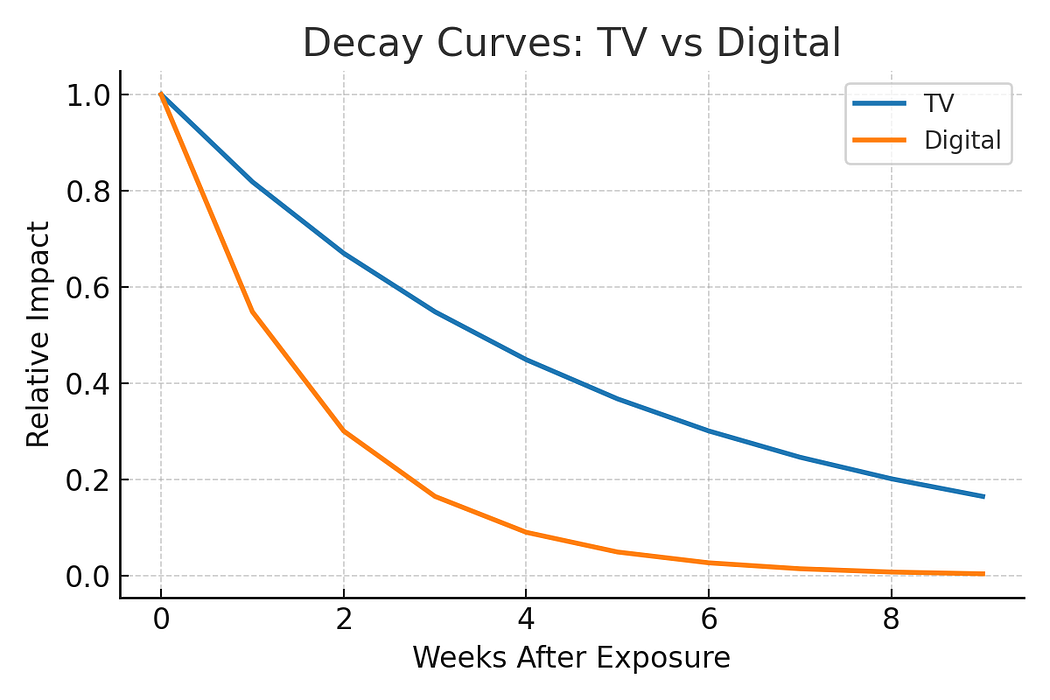
Every channel has a natural “forgetting curve.”
- Digital formats: Can drop off in 2–3 days without reinforcement.
- TV/Longer-form: Slower decline, sometimes 10–14 days.
Creative type matters too. A funny campaign can stretch memory longer than a price promo.
The art is in matching your cadence to this decay — refresh too early and you overspend, refresh too late and you lose salience.
3. Why It’s Never About One Week’s GRPs
This is where many schedules fail. We treat weekly GRPs as one-shots, when in reality they stack due to ad stock.
- 150 GRPs in Week 1 + 150 in Week 2 ≠ 300 fresh GRPs.
- Week 2 builds on Week 1’s residuals, creating compounding awareness — but also risking diminishing returns if overdone.
Campaigns that taper and phase (build → sustain → taper) often outperform those that simply dump budgets upfront.
4. Where It Gets Real
In our calibrations across multiple MMMs, TV consistently shows longer-lived stocks than Digital, but the precise “half-lives” vary by category.
- A CPG TV burst doesn’t behave like an Auto TV burst.
- A Reels ad doesn’t decay at the same rate as a YouTube skippable.
That’s why we don’t rely on rules of thumb — we model it.
(I’m deliberately not unpacking the math here — we use a geometric ad stock model to simulate this week by week, but that’s something better shown than told.)
Press enter or click to view image in full size

5. The Takeaway for CMOs
Don’t just ask, “How many GRPs did we run last week?”
Ask instead: “What’s the residual stock of GRPs we’re carrying into this week?”
Shift focus from spend totals → memory dynamics.
Where to Go Deeper
We’ve built calibrated decay curves and campaign simulators that show when to refresh, how much to taper, and what cross-channel cadences work best.
If you’d like to see how your category curves look — or test spike vs. spread scenarios for your next campaign — reach out and we’ll walk you through the models.
Featured Blogs

TRENDS 2024: Decoding India’s Zeitgeist: Key Themes, Implications & Future Outlook

How to better quantify attention in TV and Print in India

AI in media agencies: Transforming data into actionable insights for strategic growth

How the Attention Recession Is Changing Marketing

The New Luxury Why Consumers Now Value Scarcity Over Status

The Psychology Behind Buy Now Pay later

The Rise of Dark Social and Its Impact on Marketing Measurement

The Role of Dark Patterns in Digital Marketing and Ethical Concerns

The Future of Retail Media Networks and What Marketers Should Know
Recent Blogs

Operating in the Age of Agents (The New Operating Model)

Ad Stock & Decay: The Invisible Hand Guiding Media Schedules

The Big Mac Illusion:What a Burger Tells Us About Global Economics

When Search Starts Thinking How AI Is Rewriting the Discovery Journey

CEP Tracker The Modern Brand Health Metric
